| 1.4115 |
1.4135 |
1.4151 |
1.4190 |
1.4245 |
1.4260 |
1.4285 |
|
|
| Rolling 30-day USD/CAD Value Areas |
| Extreme Value Buy |
Solid Value Buy |
Good Value Buy |
Spot |
Good Value Sell |
Solid Value Sell |
Extreme Value Sell |
| 1.3835 |
1.3905 |
1.4015 |
1.4190 |
1.4280 |
1.4335 |
1.4395 |
|
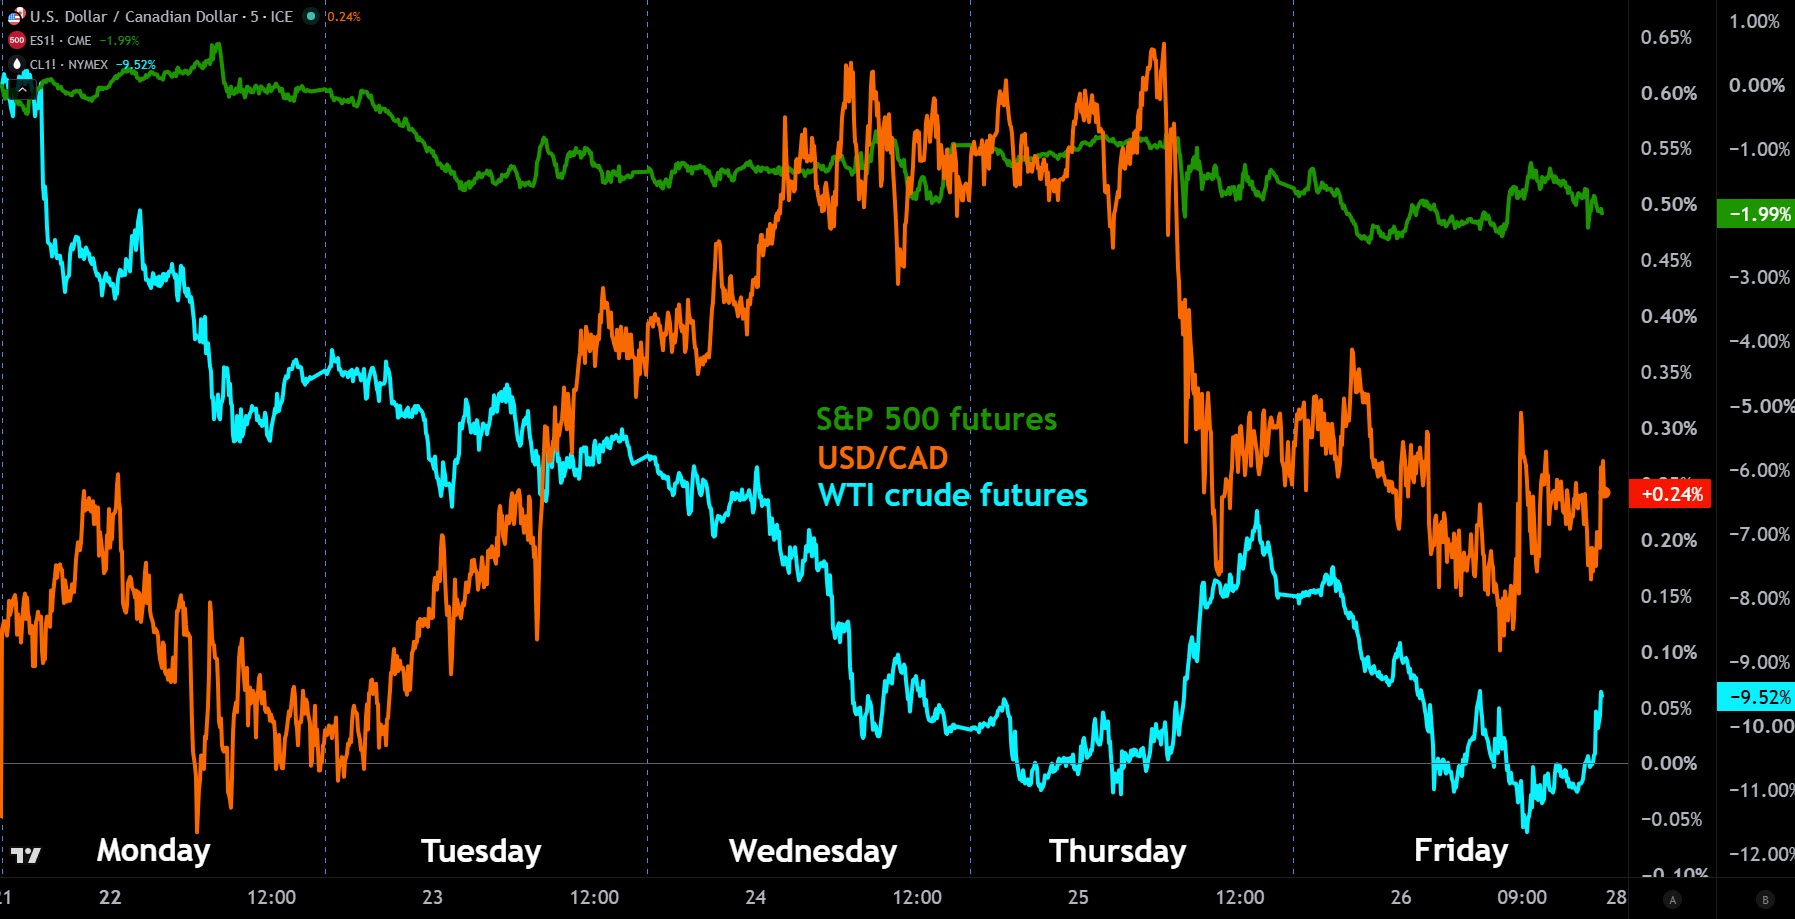
- Monday set a geopolitical tone to kick off the week, with USD/CAD grinding higher to finish at 1.4157 after a 1.4145–1.4193 range. The session was heavily influenced by whipsawing oil prices and a hot Canadian inflation print. As we outlined in last week’s report, a hot headline CPI print (+1.0% m/m vs 0.7% est; 3.2% y/y) failed to trigger a sustained CAD rally, with fast-money accounts aggressively fading any intraday CAD strength as domestic inflation played second fiddle to broader macro forces. The Bank of Canada's preferred core measures remained better behaved (Core CPI at 2.2% y/y), allowing the market to look past the gasoline-driven headline surge. Meanwhile, WTI crude initially gapped higher on fears of a Strait of Hormuz closure before selling off hard to settle at $74.82 as the US suspended sanctions on Iranian energy production for 60 days. With no US data on the docket, the greenback remained broadly firmer against its G10 peers, pushing the US–Canada 2-year yield spread slightly wider to 142.0 bps in a choppy start to the week.
- Broad USD strength dominated Tuesday's session as USD/CAD surged to a new yearly high of 1.4217 before closing at 1.4208. A sharp risk-off impulse hammered equity markets, with the Nasdaq plunging 2.21% and the S&P 500 shedding 1.44%, fuelling a massive flight-to-safety bid for the greenback. The DXY climbed 0.38% as the US dollar advanced against all major currencies. On the data front, US S&P Global flash PMIs beat expectations (Manufacturing at 55.7 vs 54.6 est; Services at 51.3 vs 51.1 est), underscoring US economic resilience. Meanwhile, Fed's Goolsbee struck a hawkish tone, warning that inflation is “going the wrong way.” North of the border, BoC Governor Macklem's speech in Paris offered no new monetary policy signals, instead highlighting the enduring appeal of the US dollar and its dominance in global capital flows. With WTI crude oil settling below its 200-day moving average at $73.21, the Canadian dollar found absolutely no relief, allowing USD/CAD to extend its powerful uptrend.
- Wednesday saw USD/CAD grind higher for a sixth consecutive day, advancing 0.18% to close at 1.4229 amidst a deepening tech-led equity selloff. The greenback remained well-bid as a global risk-off mood intensified, dragging the Nasdaq down another 3.29% on the back of aggressive semiconductor profit-taking. While US data was mixed—with New Home Sales missing expectations (580K vs 638K est) and EIA crude inventories posting a larger-than-expected draw (-6.088M)—the broader macro environment kept the US dollar supported near multi-year highs. The release of the Bank of Canada's meeting minutes revealed a Governing Council caught in a dilemma, emphasizing that monetary policy must remain “nimble” while explicitly citing unfavourable USMCA trade negotiations as a risk to jobs and investment. This structural trade overhang continued to deter real money accounts from buying the Canadian dollar, keeping a firm floor under the pair even as WTI crude briefly broke below the $70/bbl threshold for the first time since the start of the Iran conflict.
- The relentless USD bid finally ran out of steam Thursday, allowing USD/CAD to slip to a 1.4195 close as the Canadian dollar emerged as the strongest G10 currency on the day. The highly anticipated US PCE report printed exactly in-line with expectations (Core PCE at 0.3% m/m and 3.4% y/y), reinforcing the narrative of sticky but peaking inflation and prompting a modest rally in US Treasuries. With the US 10-year yield dropping 2 bps to 4.40% and the US–Canada 2-year spread narrowing to 136.9 bps, the greenback sagged broadly against its peers. The loonie caught an additional tailwind from a bounce in the energy complex, as WTI crude climbed $1.77 to $71.92 amid reports of Iranian mines delaying the return to normal traffic flows in the Strait of Hormuz. Despite the intraday dollar weakness, the broader trend remained intact, with Fed's Goolsbee reiterating concerns over services-driven core inflation and keeping the prospect of any imminent rate cuts firmly off the table.
- Friday capped off a resilient week for the Canadian dollar as USD/CAD dipped to 1.4190, though the pair still managed a 0.29% week-over-week gain. The greenback ended the session mixed after a disappointing US Advance Goods Trade Balance print (-$105.8B vs -$85.0B est) weighed on Q2 growth expectations, while the UMich Consumer Sentiment index beat forecasts (49.5 vs 48.9 est). Despite the softer trade data, Fed's Kashkari delivered a notably hawkish shift, penciling in one rate hike by year-end and warning that inflation pressures are becoming more broad-based. WTI crude oil reversed Thursday's gains to settle down 3.74% at $69.23—a staggering 9.5% week-over-week decline—as markets grew increasingly confident that Middle East tensions would not structurally disrupt energy flows. The S&P 500 closed down 0.05%, sealing its worst weekly performance (-1.95%) since early June, as AI-related volatility continued to shake out weak hands. With the US–Canada 2-year yield spread narrowing slightly to 134.5 bps, USD/CAD consolidated near the highs, perfectly encapsulating a week dominated by yield divergence and lingering trade pessimism.
|
-
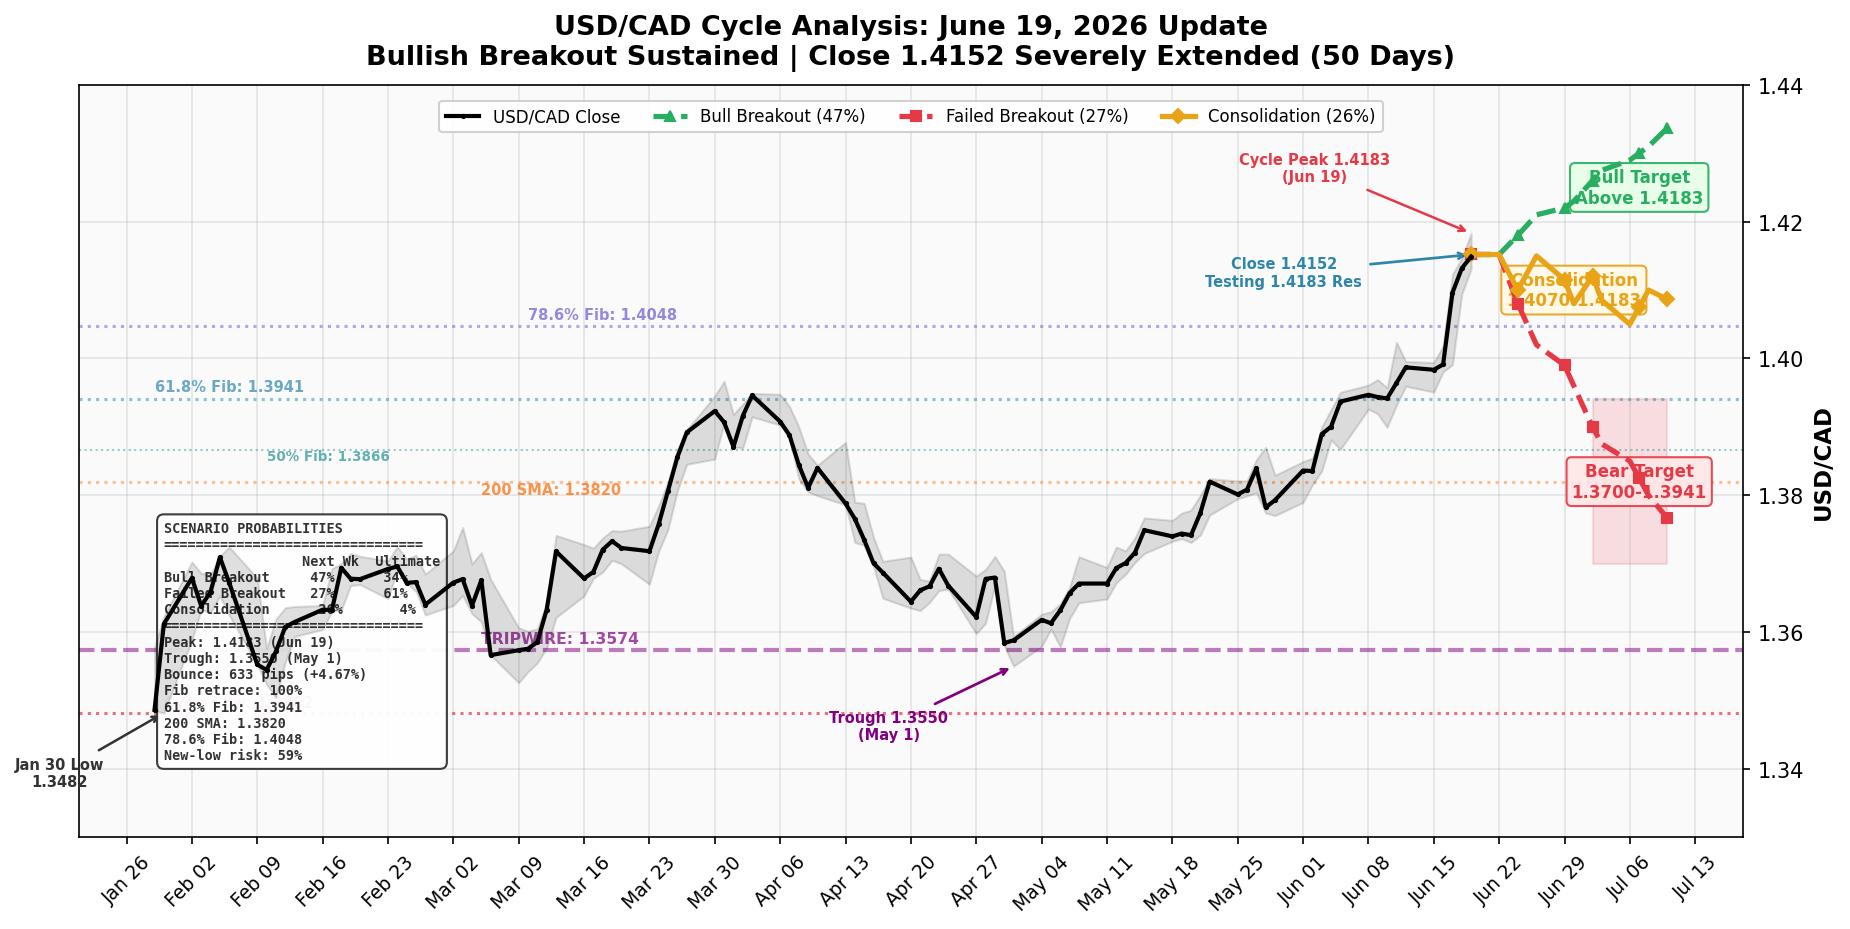
Cycle Update (June 26): Stretched Rally Hits Resistance. Spot surged to a cycle high of 1.4248 this week before pulling back to close at 1.4190, sitting just 6 pips below the 5-day SMA resistance.
Overextended Upside
The current bullish leg from the 1.3550 trough has now stretched 698 pips (+5.15%) over 55 days, vastly exceeding the median bull market minor up-leg duration of 17 days and magnitude of 3.81%. With spot running out of momentum just below the 1.4196 short-term resistance, the mathematical risk of a mean-reverting pullback is rising, even though the immediate momentum still favours the bulls.
| Consolidation |
26% |
4% |
1.4133 - 1.4196 |
| Bear Reversal |
27% |
61% |
Targets 1.3899 |
| Bull Continuation |
47% |
34% |
Targets 1.4250+ |
Why It Matters
While the macro context remains bullish, sequence analysis of 189 comparable cycles warns that up-legs of this duration (55 days vs 17-day median) are highly susceptible to exhaustion. The ultimate 61% probability of a bearish mean reversion underscores the risk that spot will eventually seek out its 50% Fibonacci level at 1.3899 (currently 291 pips below spot) before the macro trend resumes in earnest.
Macro Context
- Macro context: BULL (Up from 1.3485 to 1.4248, +5.66%)
- Distance to 50% Fib retracement: 291 pips below at 1.3899
- Macro bear tripwire status: 1.3574
Trigger Levels
- Bull trigger: Close above 1.4196 (5 SMA) → Targets 1.4250+
- Bear trigger: Break below 1.4133 (10 SMA) → Targets 1.3899 (50% Fib)
- Neutral: Price between 1.4133 and 1.4196 → Consolidation continues
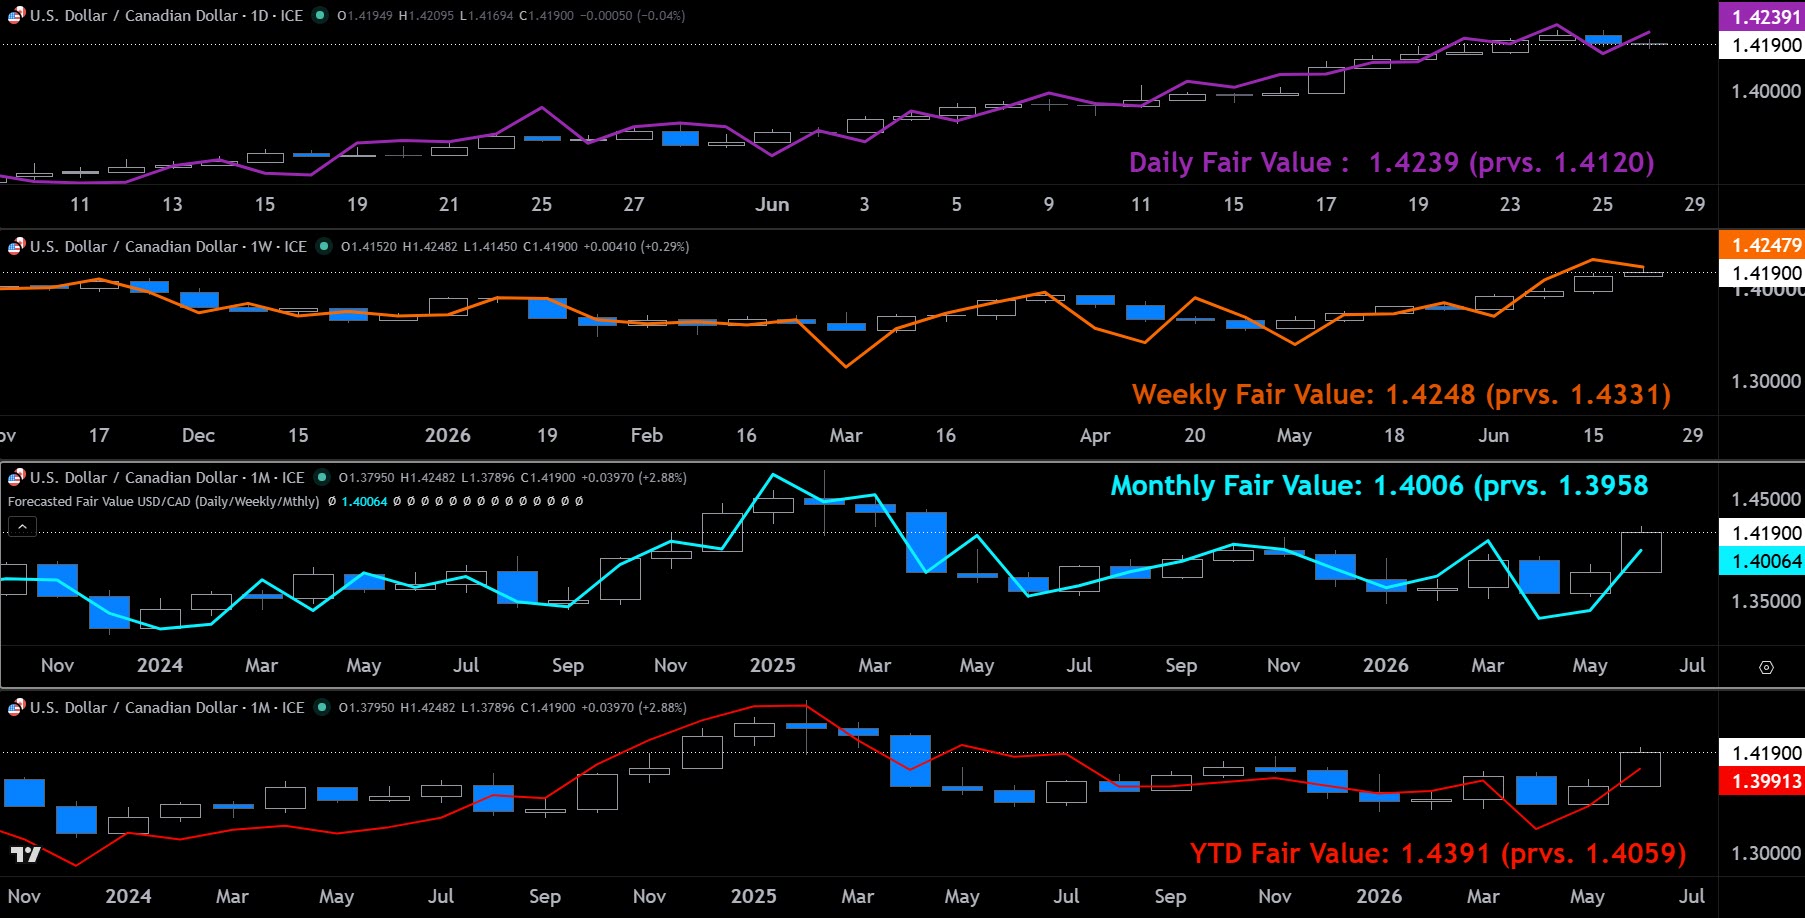
- FX fair value was mixed this past week as the weekly and year-to-date models slid, but the monthly and daily models climbed higher. We wonder if we are going to see a retracement lower into next Thursday's jobs report, but even if true, we doubt we'll see a large drop. The weekly model posits 1.4248 as fair value, which is only half a cent above spot 1.4190, and near enough to suggest no strong over valuation. However, with retail traders starting to buy USD/CAD we are a mite worried that USD/CAD could start rolling over, though if the US/Iran peace MOU starts breaking, which is always a chance, this could help keep the USD supported. For now, while valuations look rich, and we wouldn't be chasing USD higher, we'd still say dip buying not too far from spot may be the safest play into next week's NFP report.
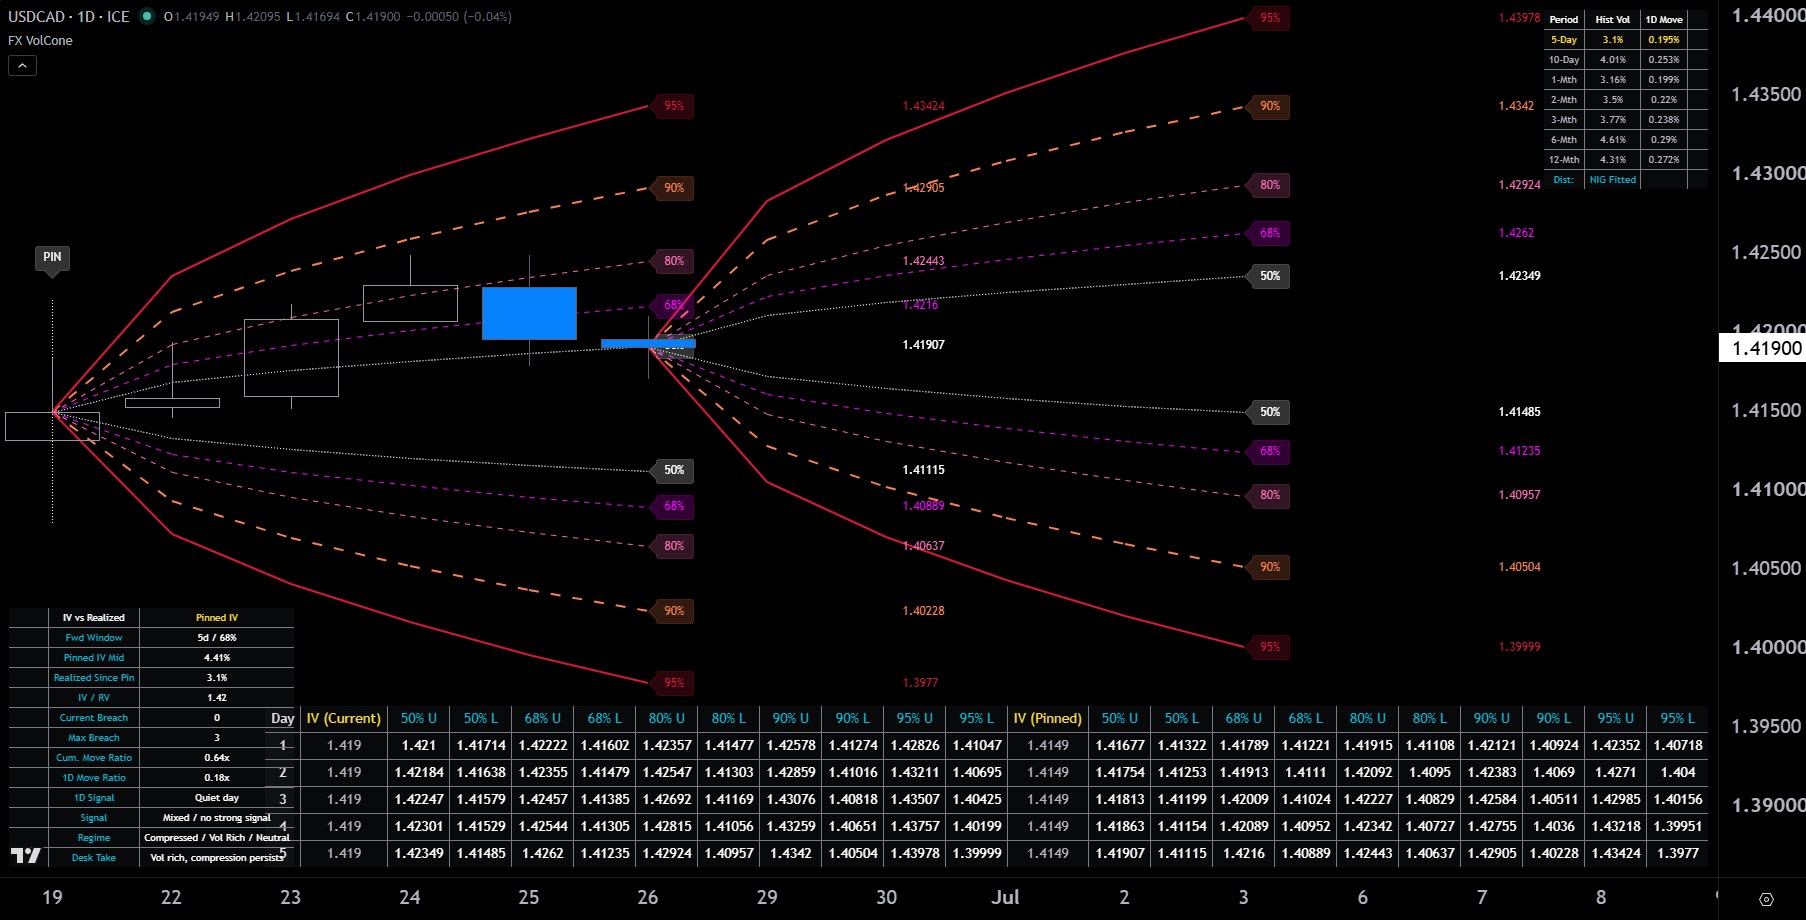
- Implied volatility overstated last week's realised movement, and while options retain a mild upside bias for USD/CAD, the market expects relatively contained conditions for the week ahead. Realised 5-day historical volatility came in at a muted 3.95%, trailing the 4.79% mid implied volatility and signalling that options priced significantly more movement than actually occurred. Looking ahead to a holiday-compressed schedule, the market is pricing a 68% probability that spot will remain within a core 1.4120 to 1.4258 range over the next five trading days, with a tighter 50% probability band set at 1.4145 to 1.4231. While the volatility skew remains positive at +0.36%—indicating that upside USD/CAD risk continues to be priced at a modest premium compared to downside protection—the overall structural setup suggests options markets are preparing for a calmer week of trading unless key US payrolls data forcefully disrupts the current regime.
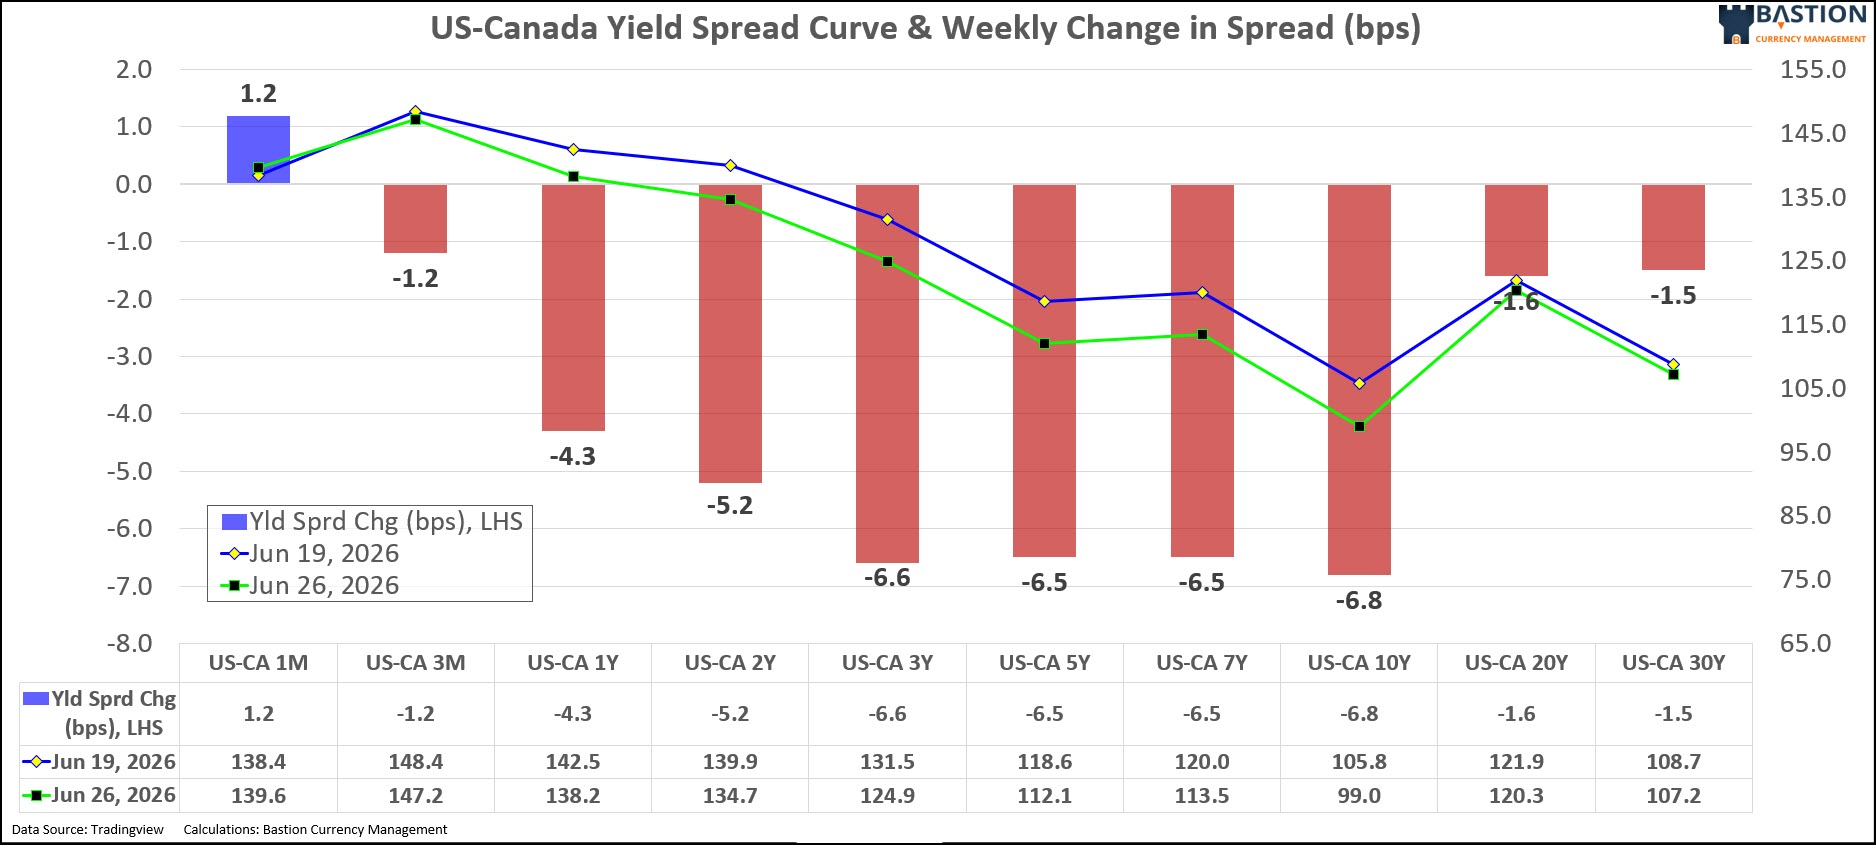
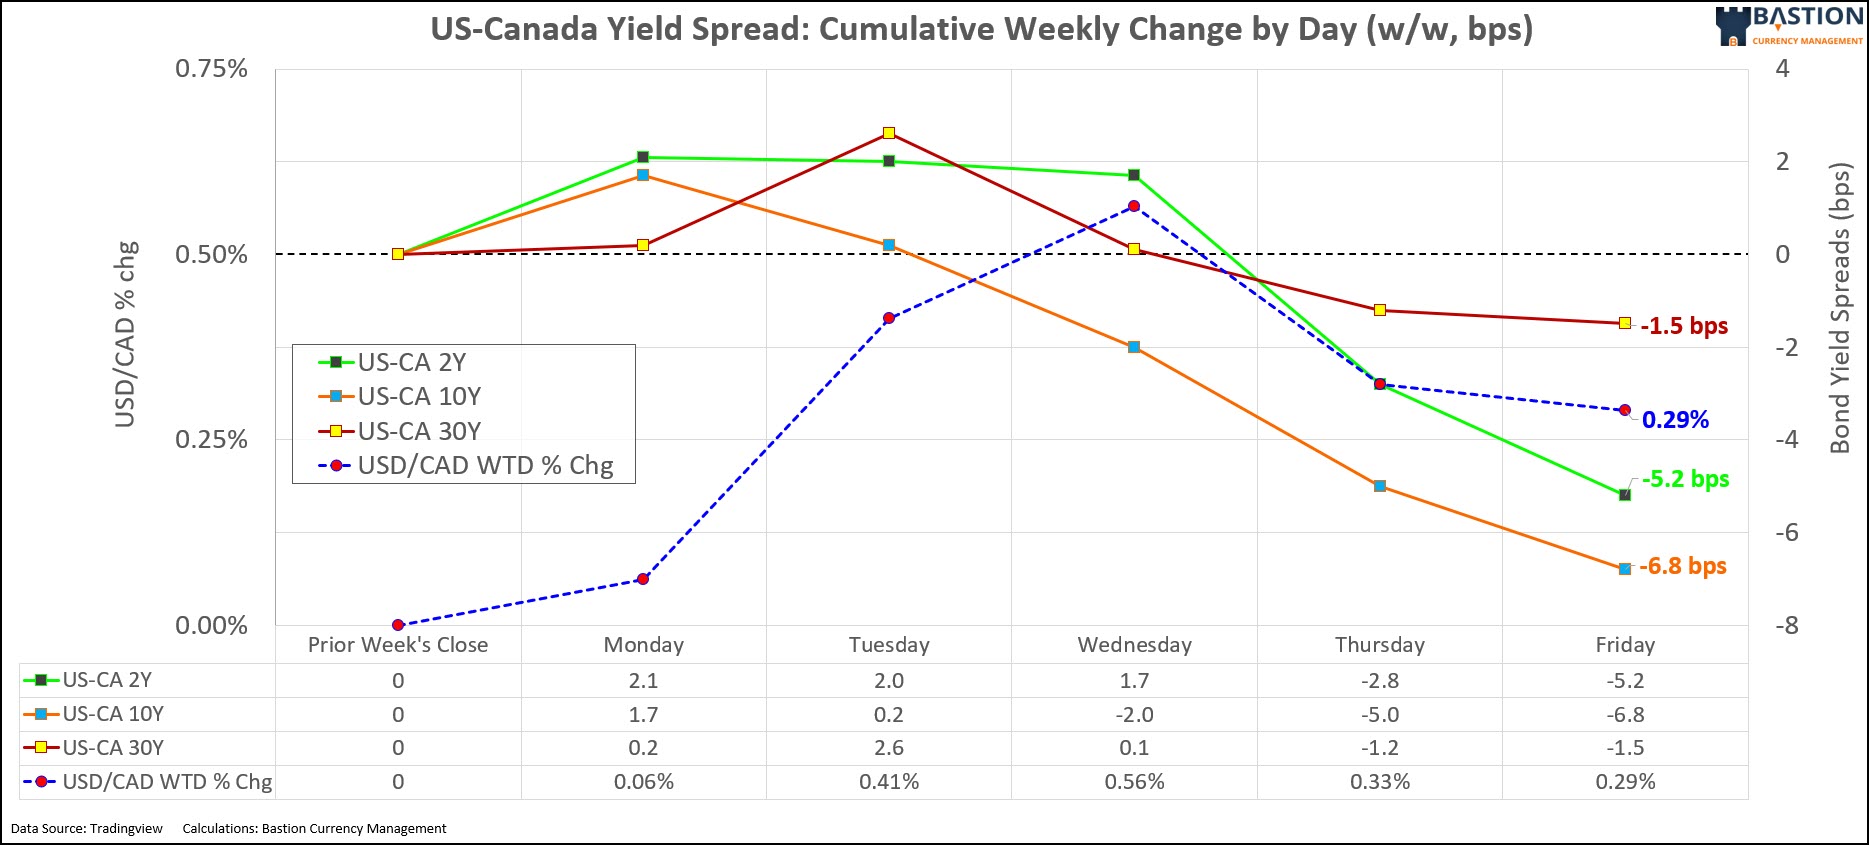
- US-Canada yield spreads narrowed across the curve this week, yet USD/CAD defied the usual rate signal to finish higher as broader macro forces took the wheel. The 2-year and 10-year spreads compressed by roughly 5 bps and 7 bps respectively, a traditionally CAD-supportive move that gained momentum over Thursday and Friday, while the 30-year spread saw a more muted 1.5 bps narrowing. However, the loonie was unable to capitalise on this relative rate advantage. Instead, a combination of hawkish FOMC reverberations driving broad US dollar strength and a sharp slide in crude oil prices overpowered the yield differential, completely offsetting the rate signal and allowing USD/CAD to notch a ~0.3% gain for the week.
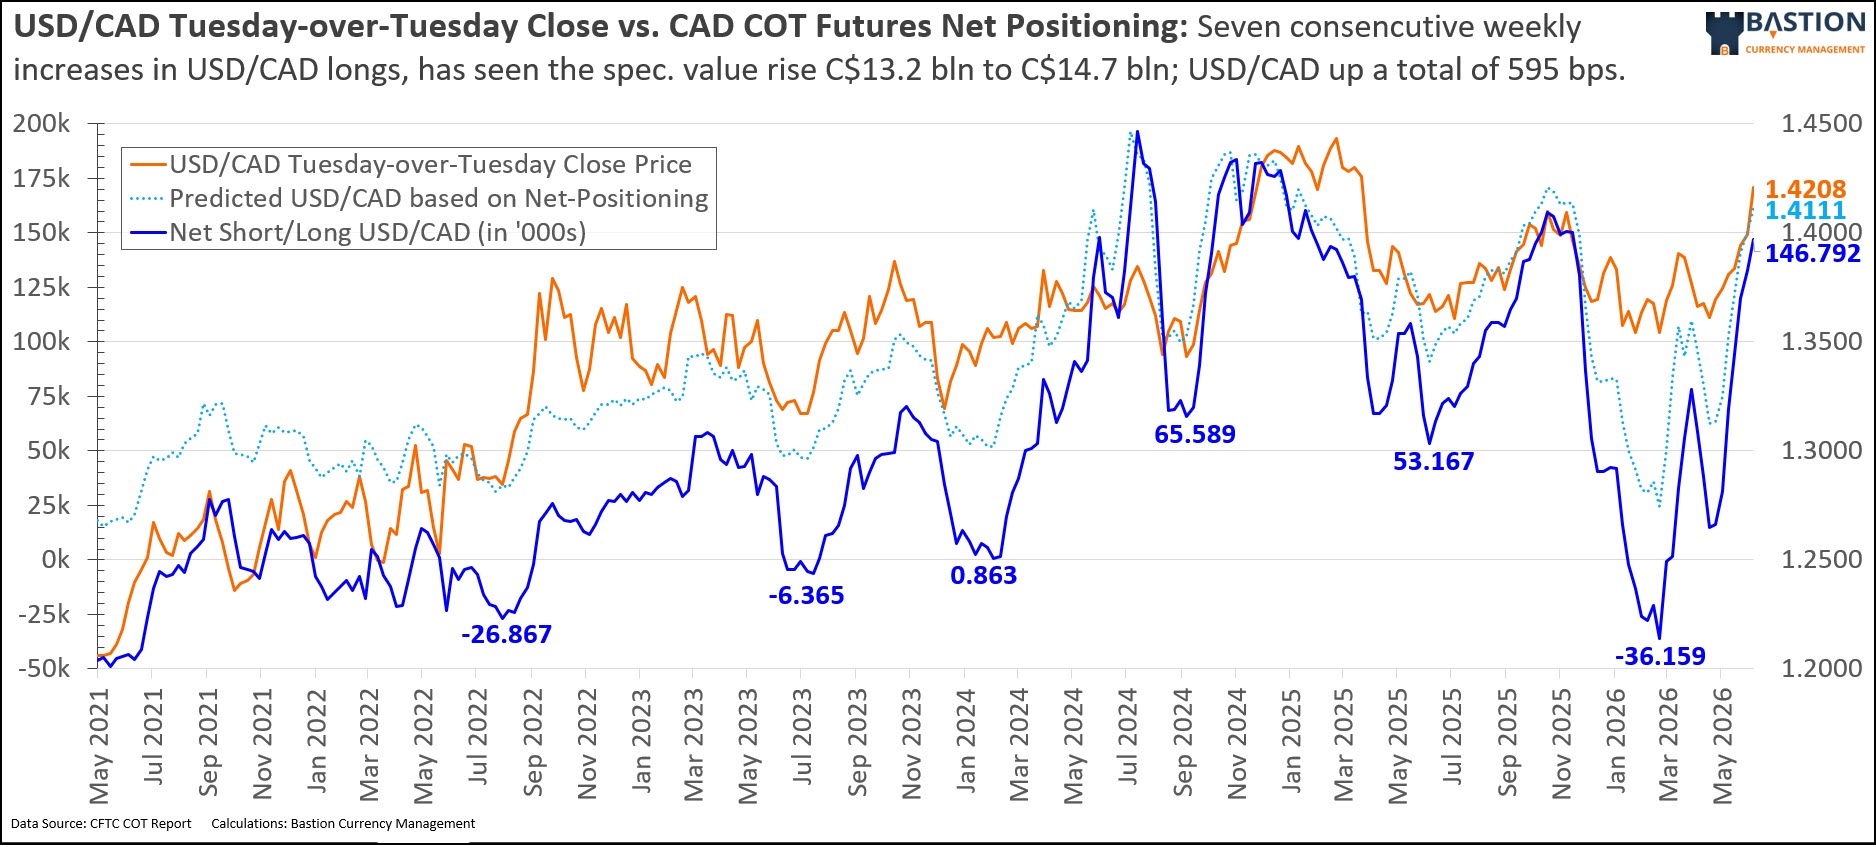
- 'Pro' traders confidently leaned into the USD/CAD rally, adding substantial length to their net long positioning into Tuesday's close. CFTC COT data showed speculative models added 13.9k contracts to their aggregate bullish bets, pushing total net long positioning to 146.8k contracts. This addition coincided with a massive 216 bps Tuesday-over-Tuesday surge in the spot rate, confirming that these predominantly trend-following models are aggressively chasing the breakout. Given that institutional pro positioning typically lags spot movements by two to three weeks, the sheer momentum of this rally suggests their algorithmic models will likely continue to signal accumulation, reinforcing structural support under USD/CAD on any near-term pullbacks.
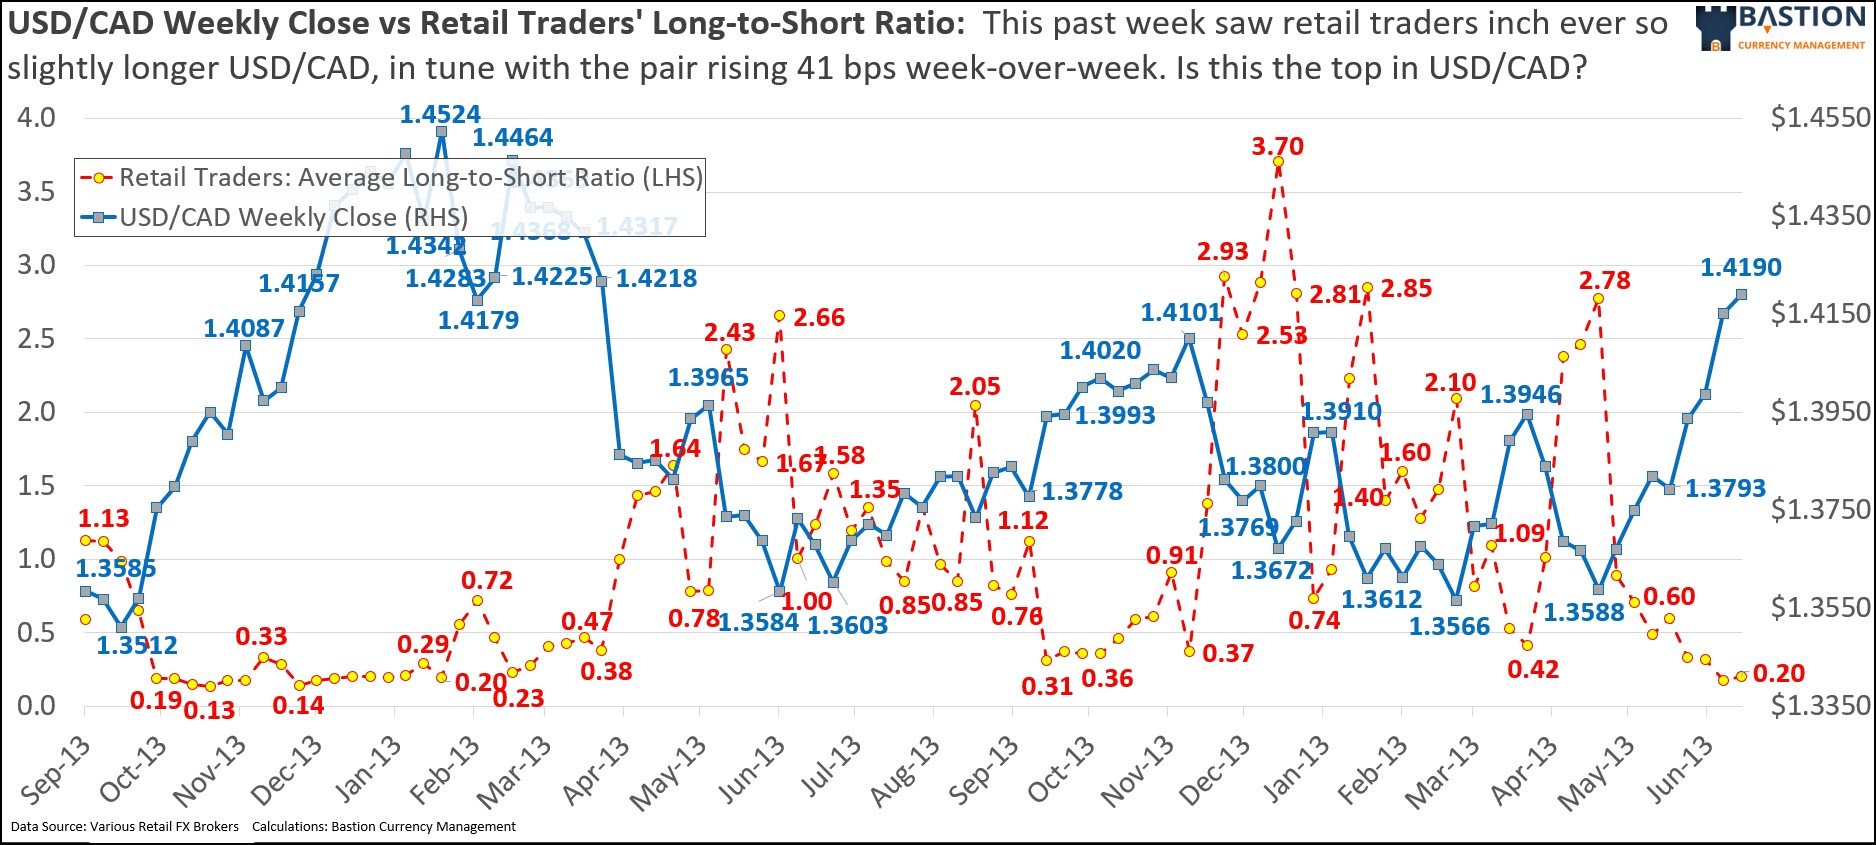
- Retail traders remain heavily short USD/CAD, offering a contrarian signal that the current rally may have further room to run. As of Friday's close, retail positioning stood at an extreme 16.8% net long, barely ticking up from the previous week's 15.1%. With USD/CAD steadily climbing throughout the week, the retail crowd has continued to aggressively fade the move. Based on the Bastion extreme rule, this overwhelming retail short bias serves as a powerful contrarian indicator, suggesting that until we see retail capitulate and start buying the pair, the path of least resistance for USD/CAD remains decisively to the upside.
|
- USD buyers should be bidding 1.4151, parking orders decently above the 10-day moving average and the lower boundary of the 50% probability band, and at a support zone we saw from June 18/22/23 (June 23 low 1.4151). Importers enjoyed a slight pullback from the week's highs, but the temptation to keep waiting for significantly cheaper dollars should be tempered by the underlying strength of the US dollar. Placing a bid at 1.4151 front-runs the 10-day SMA (1.4133), which rising at 20 bps/day, while sitting comfortably inside the option-implied 50% confidence band (1.4145). If Thursday's US Nonfarm Payrolls report surprises to the downside, we could easily see a quick spike lower to fill these orders. However, if you are looking for a more conservative entry and are willing to wait, bidding the 21-day SMA at 1.4015 remains a structurally sound downside target given the cycle's ultimate 61% probability of a bearish mean reversion.
- USD sellers should look to offer into a bounce at 1.4244, positioning just below the recent cycle peak. Exporters have benefited from the loonie's weakness, and while the immediate momentum has stalled just below the 5-day SMA (1.4196), the path of least resistance remains higher. Offering 1.4245 takes advantage of the upper edge of the 68% probability band and front-runs the formidable cycle high of 1.4248. Given that retail traders remain overwhelmingly short, a contrarian squeeze driven by a strong US JOLTS or NFP print could easily propel spot back to these levels. If you simply want a fill regardless of the bounce, stepping in at current spot around 1.4195 is a reasonably conservative choice.
|
|
Utilizing FX Option pricing and combining probability theory and statistics, we present below, for the coming week and the upcoming month, what the numbers "suggest" for USD/CAD pricing, ranges, and probabilities using a normal distribution. The option strikes we used are noted inside the parentheses() in the row headers "Prob. Price Above Upper Boundary ( )" for the call option, and "Prob. Price Below Lower Boundary ( )" for the put option.
|
| Prob. Price Above Upper Boundary (1.4245) |
25.78% |
53.10% |
| Prob. Price Below Lower Boundary (1.4119) |
24.47% |
47.55% |
| Implied Range (60% Probability) |
- |
1.4139 - 1.4237 |
| Implied Range (40% Probability) |
- |
1.4110 - 1.4268 |
| Implied Range (30% Probability) |
- |
1.4092 - 1.4288 |
| Implied Range (20% Probability) |
- |
1.4070 - 1.4312 |
| Implied Range (10% Probability) |
- |
1.4038 - 1.4348 |
| Implied Range (5% Probability) |
- |
1.4010 - 1.4379 |
| Prob. Price Being Between Boundaries (1.4119 - 1.4245) |
49.75% |
100% |
| Prob. Either Boundary Touched (1.4119 - 1.4245) |
- |
91.77% |
| Prob. Neither Boundary Touched (1.4119 - 1.4245) |
- |
8.23% |
| Prob. Price Touching Both Boundaries (1.4119 - 1.4245) |
- |
8.83% |
|
| Prob. Price Above Upper Boundary (1.4300) |
25.36% |
53.83% |
| Prob. Price Below Lower Boundary (1.4041) |
24.68% |
46.73% |
| Implied Range (60% Probability) |
- |
1.4089 - 1.4291 |
| Implied Range (40% Probability) |
- |
1.4030 - 1.4355 |
| Implied Range (30% Probability) |
- |
1.3994 - 1.4394 |
| Implied Range (20% Probability) |
- |
1.3950 - 1.4443 |
| Implied Range (10% Probability) |
- |
1.3883 - 1.4517 |
| Implied Range (5% Probability) |
- |
1.3826 - 1.4582 |
| Prob. Price Being Between Boundaries (1.4041 - 1.4300) |
49.97% |
100% |
| Prob. Either Boundary Touched (1.4041 - 1.4300) |
- |
91.68% |
| Prob. Neither Boundary Touched (1.4041 - 1.4300) |
- |
8.32% |
| Prob. Price Touching Both Boundaries (1.4041 - 1.4300) |
- |
8.71% |
|
|
Definitions: "At Period End" means that the prices/probabilities represented under that header are expected to be relevant on that terminal day. In contrast, "At Any Time During Period" suggests that the numbers in the column below the header are likely to occur and be valid at any point during the date range given. "Prob. Price Above Upper Boundary" is the chance that the price will close above the upper boundary at the final date irrespective of where it may trade up until then. "Prob. Price Below Lower Boundary" is the chance that the price will close below the lower boundary at the final date irrespective of where it may trade up until then. "Implied Range (x% Probability)" is the range that the currency is expected to trade within given a certain probability. In other words, an Implied Range (60% probability) suggests that the exchange rate has a 60% chance of staying within that given range (e.g., 1.2500-1.2600) over the time period. "Prob. Price Being Between Boundaries" is the probability the price will end between the two boundaries "At Period End" or the probability the price will trade inside the boundaries "At Any Time During Period". "Prob. Either Boundary Touched" is the probability that either the upper or lower boundary will be touched at any point during the date range specified. Prob. Neither Boundary Touched is the probability that neither the upper nor lower boundary will be touched at any point during the date range specified. Prob. Price Touching Both Boundaries is the probability that both the upper and lower boundary will be touched at some point during the date range specified.
|
Quick Take:
- A hawkish June FOMC has shifted the tectonic plates back toward USD exceptionalism. With Fed Chairman Warsh discarding explicit forward guidance and keeping rate hike risks alive, markets are re-pricing a stronger broad dollar as the path of least resistance.
- The focus falls squarely on a condensed US labour market slate this week. With July 4th observance compressing the schedule, ADP employment, JOLTS, and Thursday's Nonfarm Payrolls will dictate if the Fed's hawkish lean is validated by underlying economic strength.
- Canadian data takes a back seat as Canada Day splits the week. Aside from April GDP on Tuesday, the domestic docket is thin, leaving USD/CAD largely at the mercy of US yield differentials and broader DXY flows.
- USD/CAD looks technically stretched but structurally supported. Trading near 1.4190, the pair is contending with deeply overbought daily RSIs approaching 89, though narrowing 2-year US/Canada yield spreads (~135 bps) might offer a window for mild CAD consolidation.
Monday serves as a quiet on-ramp to a highly compressed, holiday-shortened trading week. There are no top-tier Canadian releases, and the US slate only features the Dallas Fed Manufacturing Activity index (prior 0.4). With Friday's hawkish shock from Minneapolis Fed President Kashkari still digesting, the greenback retains its bid tone as the market pivots away from trading the dollar as a simple oil-hedge and back toward trading it on robust US rate exceptionalism.
The domestic spotlight flickers briefly on Tuesday with the release of Canadian April GDP. Consensus expects a bounce to 0.4% m/m after March's soft -0.1% print. A solid showing might offer the loonie some temporary respite, but the real fireworks will likely stem from the US, where the CB Consumer Confidence index (forecast 94.2, prior 93.1) and JOLTS Job Openings (forecast 7.36M, prior 7.618M) will provide the first major read on the health of the US consumer and labour demand.
It's a bizarre hump day: Canadian markets are entirely shuttered for Canada Day, while global focus shifts to the ECB's summer symposium. Both BoC Governor Macklem and Fed Chairman Warsh are slated to speak. With Warsh recently pushing AI-related policy implications to a task-force review, markets will be hanging on every word to gauge the Fed's reaction function in this new, forward-guidance-free era. In the US, a heavy data dump includes ADP Employment Change (forecast 110k, prior 122k) and the ISM Manufacturing PMI (forecast 53.8, prior 54.0), setting the stage for Thursday's payrolls.
Thursday crams Friday's usual volatility into an early-close session ahead of the US Independence Day observance. The marquee event is the US Nonfarm Payrolls report, with the street looking for a 130k gain (prior 172k) and stable unemployment at 4.3%. Average Hourly Earnings are expected to rise 3.5% y/y (prior 3.4%). Initial Jobless Claims and the ISM Manufacturing Employment sub-index (prior 48.6) also drop simultaneously. If the US labour market proves resilient, expect the USD to attempt a clean breakout above the 100.80 level on the DXY, which historically signals significant upside follow-through.
Friday is a write-off for North American liquidity. US markets are closed for the July 4th holiday observance, leaving trading extremely thin. The only scheduled releases of note are the weekly CFTC speculative positioning numbers in the afternoon.
To wrap up the week, USD/CAD sits near 1.4190 in a precarious technical state. Institutional desks like Citi and HSBC have formally abandoned their soft-USD views, noting that fading non-US hike pricing and resilient US data make a compelling case for further dollar strength. We see the USD rally as extremely stretched, with spot sitting well-above two standard deviations of its 100-day MA (1.3776), where it has been for the last month. A modest retracement could take spot back to the 1.4075/80 zone, but if US payrolls deliver a hawkish surprise on Thursday, expect buyers to confidently defend dips and target the 1.4250/1.4300 ceiling, so USD sellers may have a chance to get in from half a cent to a cent higher than Friday's 1.4190 close.
|
Monday, June 29 2026
| 21:30 |
CNY |
High |
Manufacturing PMI (Jun) |
|
|
50.0 |
|
Tuesday, June 30 2026
| 08:30 |
CAD |
Moderate |
GDP (m/m) (Apr) |
|
0.4% |
-0.1% |
|
| 08:31 |
CAD |
Moderate |
GDP (m/m) (May) |
|
|
|
|
| 09:00 |
USD |
Moderate |
S&P/CS HPI Composite - 20 n.s.a. (m/m) (Apr) |
|
|
1.0% |
|
| 09:00 |
USD |
Moderate |
S&P/CS HPI Composite - 20 n.s.a. (y/y) (Apr) |
|
|
0.8% |
|
| 09:45 |
USD |
High |
Chicago PMI (Jun) |
|
|
62.7 |
|
| 10:00 |
USD |
High |
CB Consumer Confidence (Jun) |
|
|
93.1 |
|
| 10:00 |
USD |
High |
JOLTS Job Openings (May) |
|
|
7.618 mln |
|
| 11:00 |
CAD |
Low |
Budget Balance (Apr) |
|
|
-29.73 bln |
|
| 11:00 |
CAD |
Low |
Budget Balance (y/y) (Apr) |
|
|
-55.28 bln |
|
| 16:30 |
USD |
Moderate |
API Weekly Crude Oil Stock |
|
|
-0.765 mln |
|
Wednesday, July 01 2026
| 05:00 |
EUR |
High |
CPI (y/y) (Jun) |
|
|
3.2% |
|
| 08:15 |
USD |
High |
ADP Nonfarm Employment Change (Jun) |
|
|
122K |
|
| 09:00 |
CAD |
Moderate |
BoC Gov Macklem Speaks |
|
|
|
|
| 09:00 |
USD |
Moderate |
Fed Governor Warsh Speaks |
|
|
|
|
| 09:45 |
USD |
High |
S&P Global Manufacturing PMI (Jun) |
|
55.7 |
55.7 |
|
| 10:00 |
USD |
Moderate |
Construction Spending (m/m) (May) |
|
|
0.4% |
|
| 10:00 |
USD |
Moderate |
ISM Manufacturing Employment (Jun) |
|
|
48.6 |
|
| 10:00 |
USD |
High |
ISM Manufacturing PMI (Jun) |
|
|
54.0 |
|
| 10:00 |
USD |
High |
ISM Manufacturing Prices (Jun) |
|
|
82.1 |
|
| 10:30 |
USD |
High |
Crude Oil Inventories |
|
|
-6.088 mln |
|
| 10:30 |
USD |
Moderate |
Cushing Crude Oil Inventories |
|
|
-1.077 mln |
|
| 11:30 |
USD |
Moderate |
Atlanta Fed GDPNow (Q2) |
|
2.5% |
2.5% |
|
Thursday, July 02 2026
| 08:30 |
USD |
High |
Average Hourly Earnings (m/m) (Jun) |
|
|
0.3% |
|
| 08:30 |
USD |
Moderate |
Average Hourly Earnings (y/y) (y/y) (Jun) |
|
|
3.4% |
|
| 08:30 |
USD |
Moderate |
Continuing Jobless Claims |
|
|
1,821K |
|
| 08:30 |
USD |
High |
Initial Jobless Claims |
|
|
215K |
|
| 08:30 |
USD |
High |
Nonfarm Payrolls (Jun) |
|
|
172K |
|
| 08:30 |
USD |
Moderate |
Participation Rate (Jun) |
|
|
61.8% |
|
| 08:30 |
USD |
Moderate |
Private Nonfarm Payrolls (Jun) |
|
|
120K |
|
| 08:30 |
USD |
Moderate |
U6 Unemployment Rate (Jun) |
|
|
8.1% |
|
| 08:30 |
USD |
High |
Unemployment Rate (Jun) |
|
|
4.3% |
|
| 09:30 |
CAD |
Low |
S&P Global Manufacturing PMI (Jun) |
|
|
52.9 |
|
| 10:00 |
USD |
Moderate |
Factory Orders (m/m) (May) |
|
|
4.8% |
|
| 13:00 |
USD |
Moderate |
U.S. Baker Hughes Oil Rig Count |
|
|
|
|
| 13:00 |
USD |
Moderate |
U.S. Baker Hughes Total Rig Count |
|
|
|
|
| 16:30 |
USD |
Moderate |
Fed's Balance Sheet |
|
|
6,736 bln |
|
|
|