Payrolls missed and the dollar rallied anyway: USD/CAD up 104 pips to a fourth straight weekly close higher, with Cdn. jobs Friday the only real test
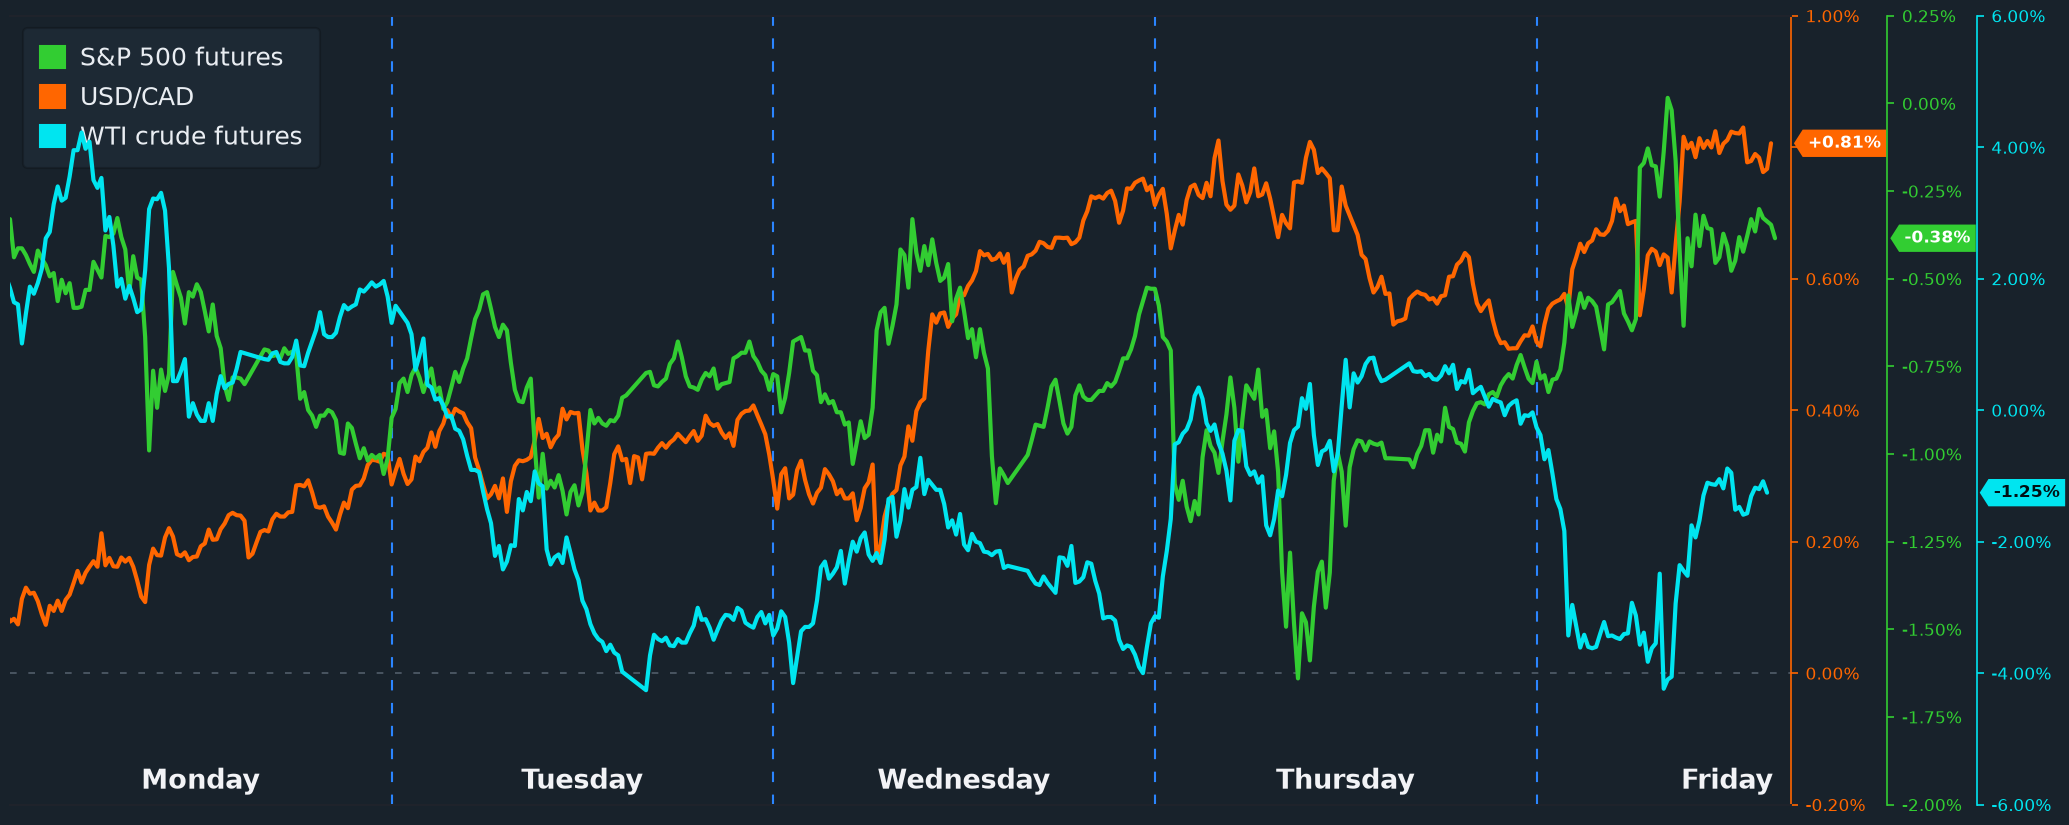
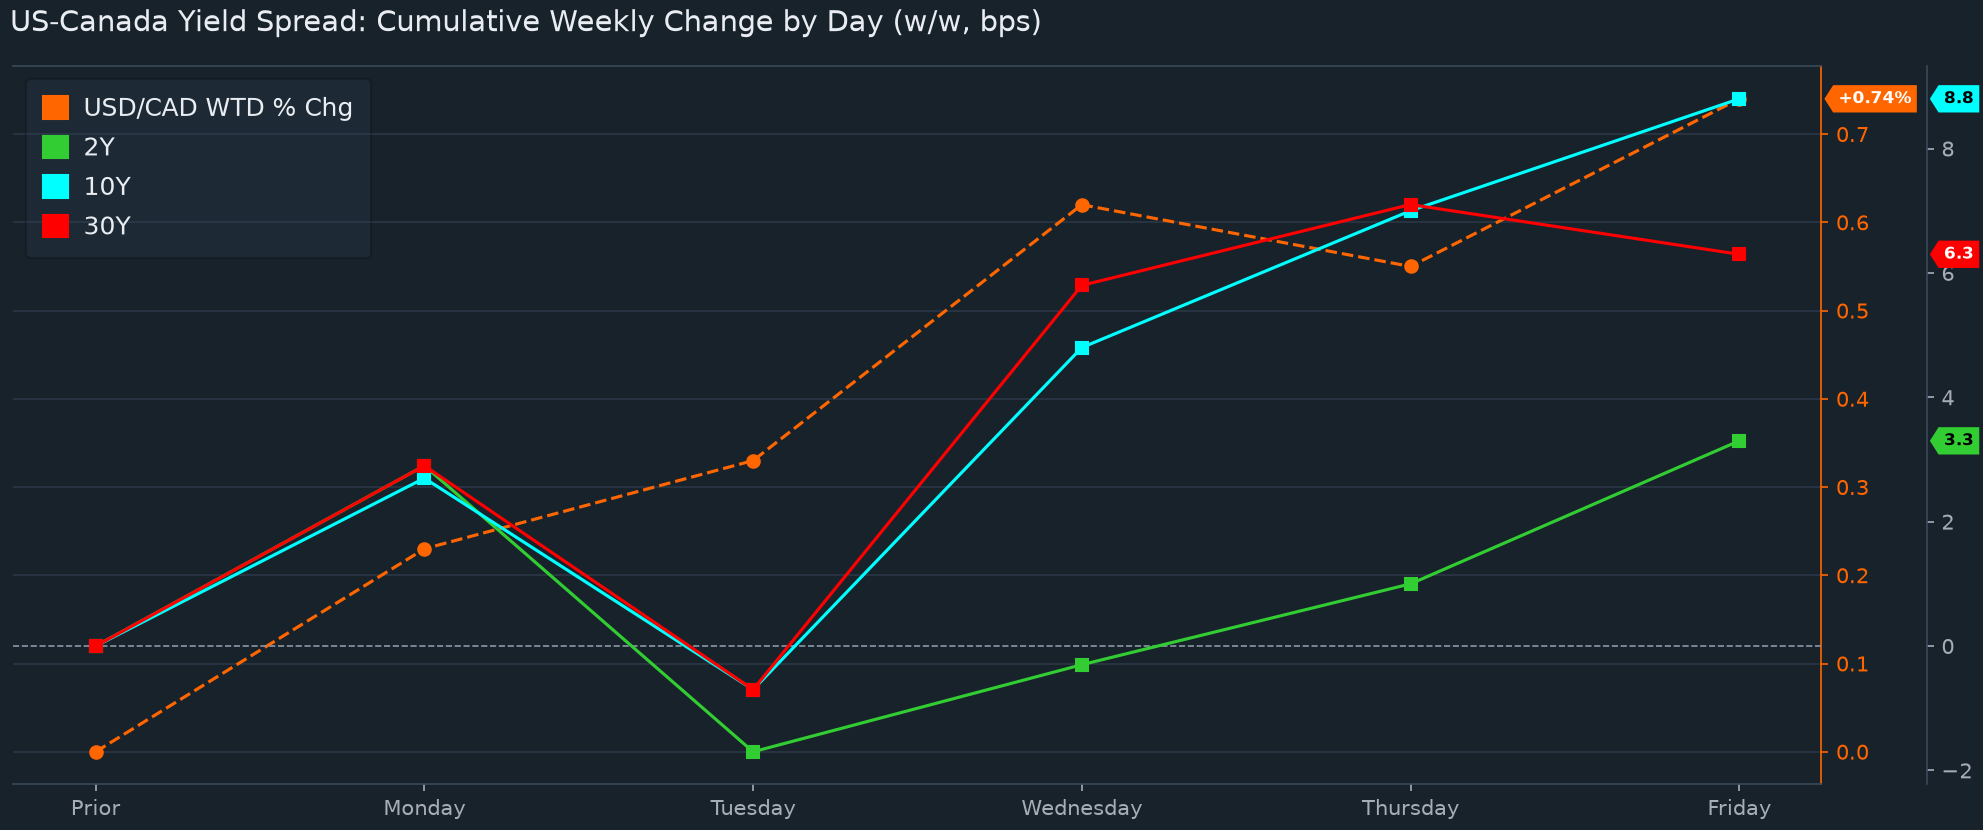
Iran did the talking Monday and USD/CAD took the dollar’s side of it, closing 1.4173 (+0.23%) after a 45-pip range between 1.4133 and 1.4178. The week opened on the view that the nuclear negotiations had hit a wall, so crude got bought, Treasury yields pressed cycle highs, stocks opened on the back foot and money ran into the dollar. Then the usual unnamed helpers appeared, first with word that mediators were still involved, then with “new proposals,” and the oil bid simply evaporated. WTI opened 93.58, printed 96.54, fell to 91.25 and settled 92.60, which is more than five dollars of round trip inside one session (nobody asked for that). There was nothing on the Canadian calendar to lean on, and the US two-year premium over Canada widened 2.9 bps. The interesting part isn’t the 45 pips, it’s that CAD got nothing out of the crude spike on the way up and paid nothing for the giveback on the way down. That asymmetry has been with us since the Fed hiked last month, and it set the tone for everything that followed.
Tuesday was the dead one, a 29-pip crawl between 1.4173 and 1.4202 that finished at 1.4187 (+0.10%). Canada’s July GDP was flat at 0.0%, bang on consensus after June’s 0.3%, with the August advance pencilled in at 0.2%. Our own testing makes that release a genuine event window, a median 11 pips in the twenty-odd minutes after it lands against a 3-pip baseline, but that needs a surprise and there wasn’t one, so nothing is what we got. The American numbers were the ugly ones. CB consumer confidence fell to 81.9 against 89.2 expected and 88.6 prior, and JOLTS openings slipped to 7.079 million from 7.335 million (consensus 7.230 million, so a miss on both counts). Williams then said the Fed likely needs one more hike at most this year and is in no hurry about it, which weighed on the front end and pulled the two-year premium 4.6 bps narrower, the only session all week it moved against the dollar. Crude fell 3.5% to 89.38 as Washington offered up more barrels from the strategic reserve. Soft data, a thinner rate advantage, cheaper oil, and the pair still closed higher. Flow, we’d guess, because the data gave no reason for it.
Hot growth and cool inflation on quarter-end Wednesday handed the dollar its best day of the week, USD/CAD dipping to 1.4155 before closing 1.4228 (+0.29%), a whisker under the 1.4237 high. Core PCE rose 0.2% m/m where 0.3% was expected and held at 3.0% y/y against a 3.3% consensus, so the inflation half of the ledger was friendly enough. The rest ran hot. Q2 GDP was revised up to 2.2% from the 1.5% estimate, personal spending jumped 0.9%, Chicago PMI leapt to 58.8 from 47.1 against a 51.2 guess, and ADP put on 90K versus 73K. Softer inflation would normally take some shine off the dollar and the dip to 1.4155 may well have been that, though whatever it was, it didn’t stick. Our read is that growth won the argument because a 2.2% economy lets the Fed hold rates where they are without breaking anything, nor would we discount month-end and quarter-end fixing flows on top of it. The Atlanta Fed’s GDPNow was cut to 3.7% from 5.0% the same morning (that series jumps around enough that we’d sooner watch it than trade it). The two-year premium added 1.4 bps and the ten-year 5.5.
Everything Thursday made, Thursday gave back, USD/CAD printing 1.4263 and then closing on its low at 1.4218 (-0.07%), a full 45 pips off the high. The morning belonged to the dollar courtesy of the ISM manufacturing prices index, which ripped to 77.9 from 71.1 against a 72.9 consensus, with firms pointing at tariffs, metals and petroleum costs. Long-dated Treasury yields went along for the ride. The headline ISM was the boring part at 54.5 versus 54.8, and initial claims fell again to 197K against 201K expected. Our own work has ISM manufacturing as a real event window, about 3.1 times the size of a normal twenty-minute move, and the first leg higher fit that nicely. Then Jefferson echoed what Williams had said on Tuesday, that there is no rush to hike again, October hike odds got pared and the whole move unwound. Crude helped, up 2.7% to 92.87 on talk of strikes resuming after the midterms and a tanker hit near Oman, and for one day CAD actually got paid for it. That 1.4263 still stands as the week’s high, which makes a close right on the day’s low a bit more telling than a 0.07% session sounds.
Payrolls missed badly Friday and the dollar got bought anyway, USD/CAD running 1.4201 to 1.4261 and settling 1.4245 (+0.19%), 104 pips higher on the week. September payrolls landed at 29K against an 89K consensus and 133K prior, private payrolls 46K versus 85K, average hourly earnings 0.1% m/m against 0.3%, and the unemployment rate ticked up to 4.2% from 4.1%. Our own testing has payrolls as one of the few releases that reliably moves this pair, about 10.7 pips per one standard deviation of surprise and in the same direction as the print, so a miss that size should have dragged USD/CAD lower, and the early dip to 1.4201 was probably exactly that. So why did it close near the high? Because the detail isn’t frightening: the jobless rate rose on a bigger labour force, with participation climbing to 61.8% from 61.6%, and cooler wages alongside Wednesday’s PCE is the mix that lets the Fed sit on its hands rather than the one that scares it. Stocks agreed, S&P 500 futures adding 0.7% on the day while still finishing 0.38% lower on the week, and crude ended it 1.25% softer. The week in one line is that the dollar’s rate edge widened even as the market trimmed its hike odds, the two-year premium closing 3.3 bps wider at 155.5 and the ten-year 8.8 wider at 133.0. The mild upside lean we published last week was the right one, if too timid. All three offers we left for USD sellers were paid, 1.4190 on Tuesday, 1.4210 on Wednesday and 1.4240 on Thursday, and buyers covering on weakness got their 1.4140 on Monday. Rates are still steering this thing.
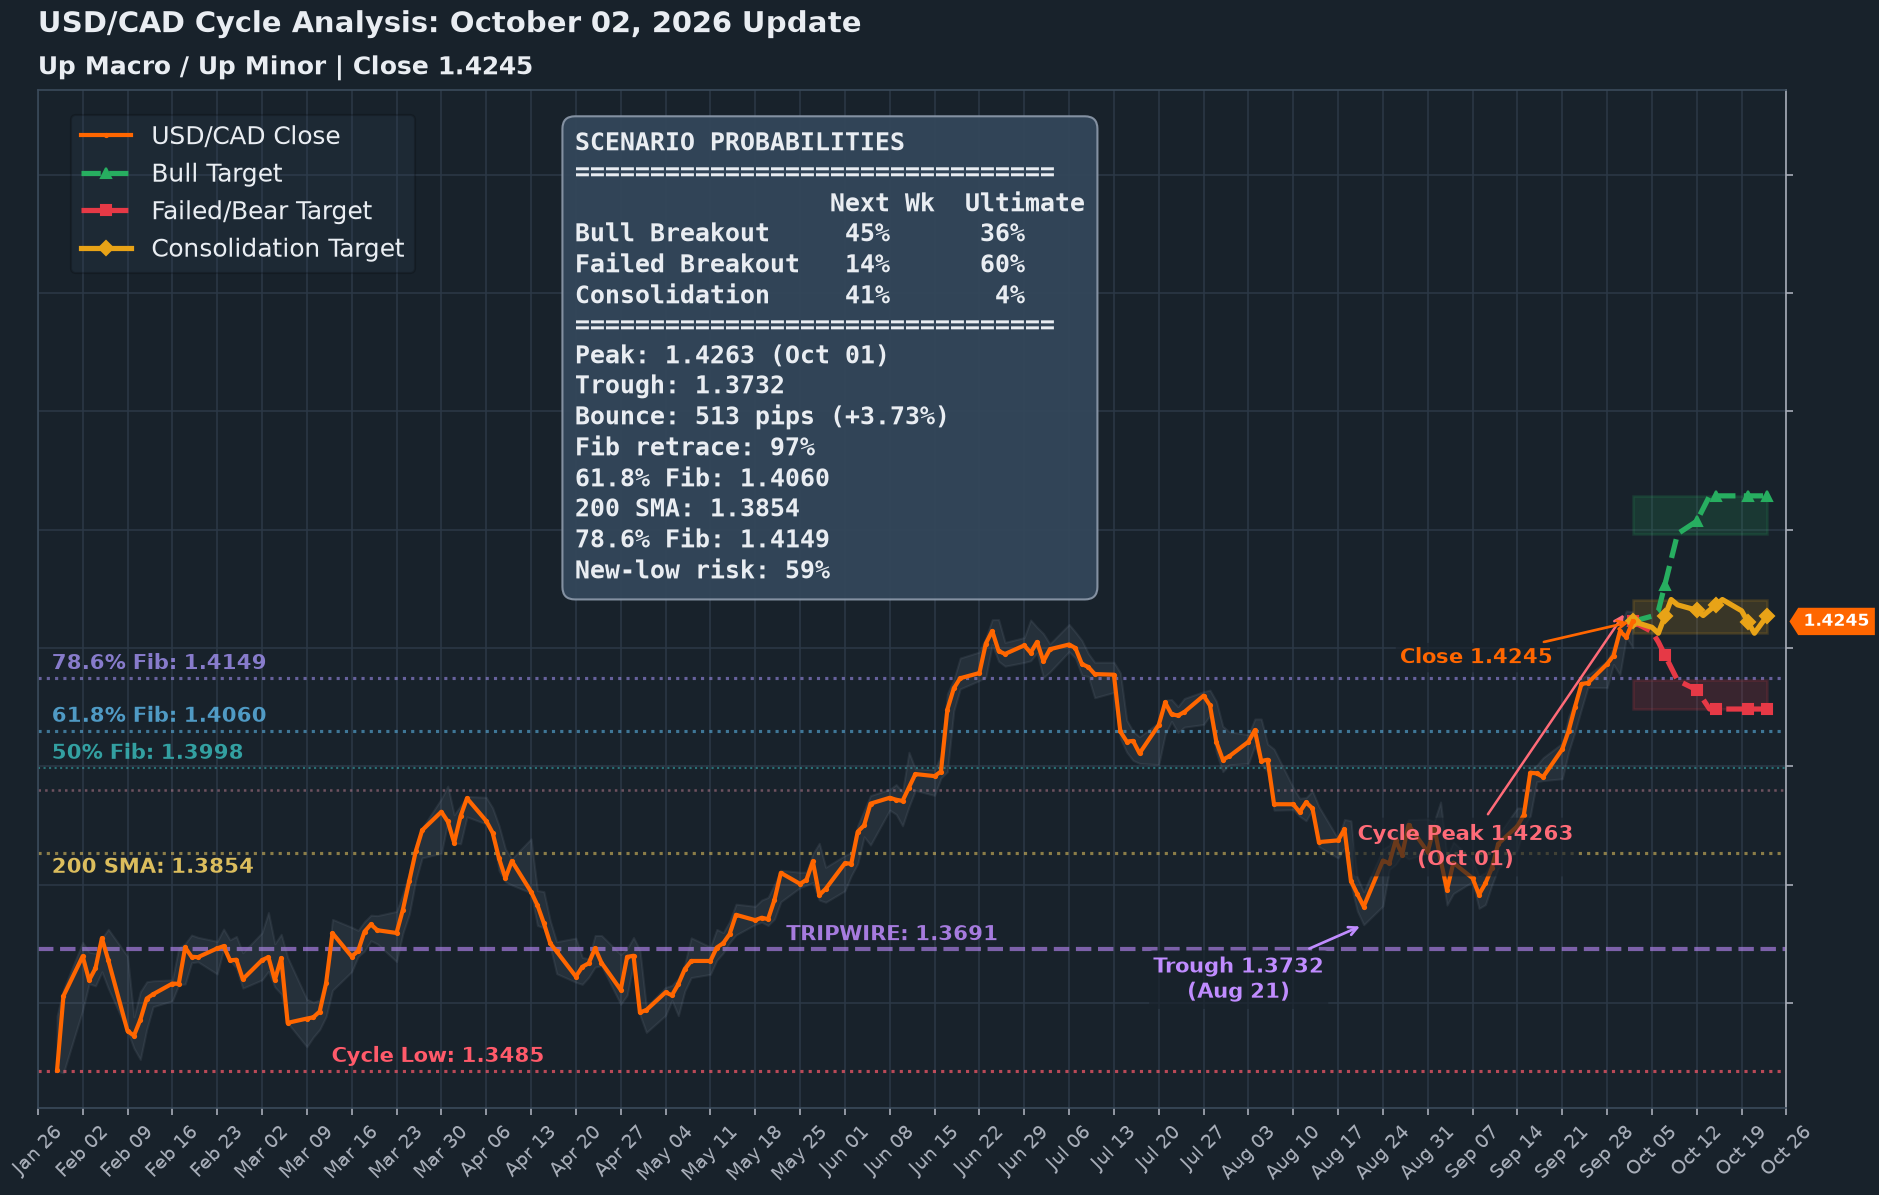
Cycle Update (Oct. 2): the leg high landed in the close. USD/CAD finished at 1.4245, up 104 pips on the week, with the range 1.4133 to 1.4263 and Thursday's print the highest of the whole up-cycle. Last week's topside trigger was a close above 1.4155, the week delivered it and then some, though the 1.4288 to 1.4352 zone that trigger pointed at hasn't been touched. The leg that began at 1.3732 on Aug. 21 is now 512.8 pips and 3.73% of upside, and Friday settled 17.8 pips under its own high, which is probably not what a top looks like. Zoom out and the macro up-cycle from 1.3485 in late January is 246 days old and worth 5.76%, a solid run, and the frame everything below sits inside.
What the comparable legs actually did. Going back to 1971, every comparable up leg inside an up macro cycle that sits where we sit now gives 45% for the advance extending over the following five days, 41% for an unresolved range and 14% for a turn lower. Same three numbers for a third week running. The median outcomes are modest, about +1.04% if the advance carries, -0.70% if it cracks and +0.07% if it does neither, so the count isn't promising fireworks in either direction. The tails say more than the middle here. The best tenth of five-day outcomes across every comparable state ran +0.99% or better, about 1.4386 from Friday's close, and the best quarter of the advances that carried ran +1.49%, which is where the top of the 1.4393 to 1.4457 zone comes from. The worst tenth gave back 0.96% or more, roughly 1.4108. These are frequencies rather than a forecast. They are what comparable states did, and the count has no idea that FOMC minutes land Wednesday or that Canada prints September jobs on Friday (prior -41.7K, with the jobless rate at 6.4%).
The longer horizon reads the other way. The leg is 42 days old against a 25-day median for comparable legs, so on the clock this advance has worked a full shift and gone into overtime. Size is a different story. The 3.73% it has gained is a hair under the 3.82% median rebound, which puts it right at the typical rebound rather than past it, so it's the duration doing the work here. That is what pulls the ultimate split to 60% bear, 36% bull and 4% range, a shade firmer on the bear side than last week's 58%. Two things worth keeping apart. The two columns answer different questions, one about the next five sessions and one about where this leg finally finishes, so they can disagree without either being wrong. And an old leg carries no date (the record counts legs, not calendars), so it is hard to say which week it matters in, and we'd guess that question belongs to a December payment more than a Tuesday one.
Scenarios, and what we'd do with them. For USD sellers this stays the friendlier side of the board. Spot sits 17.8 pips under the leg high, the near-term count has the advance at 45% and the range at 41% against 14% for a break lower, and with the trend running their way, offers worked up through the 1.4393 to 1.4457 zone are the multi-week plan rather than chasing a dip the odds don't much support. USD buyers hold the harder hand, the trend being the sellers' friend rather than theirs. The 5-day average at 1.4210, 34.6 pips under Friday's close, and the 1.4230 it should reach by Monday are the places to bid, and while that average holds, the 41% range outcome keeps the likely trade between 1.4225 and 1.4282. A break of the 5-day points at 1.4145 and then 1.4097, and we'd treat 1.4150, where the 10-day average sits, as the real line, because once that goes, 1.41 and lower opens up. Buyers whose horizon runs past this week have the 60% ultimate read on their side, which is a lean and not a schedule (and nothing in it says the up-cycle is finished).
Scenario
Next Wk
Ultimate
Range / Target
Consolidation
41%
4%
1.4225 to 1.4282
Bear Breakout
14%
60%
1.4097 to 1.4145
Bull Breakout
45%
36%
1.4393 to 1.4457
Macro Context
Macro up-cycle from 1.3485 on Jan. 29, 246 days and 5.76% of gain so far.
The up-cycle's warning level sits far below at 1.3691, with the leg's own start at 1.3732.
Trigger Levels
Bull trigger, a close above 1.4263, points at 1.4393 to 1.4457.
Bear trigger, a break of the 5-day at 1.4210, points at 1.4145 and then 1.4097.
Neither one, and 1.4225 to 1.4282 is the unresolved range.
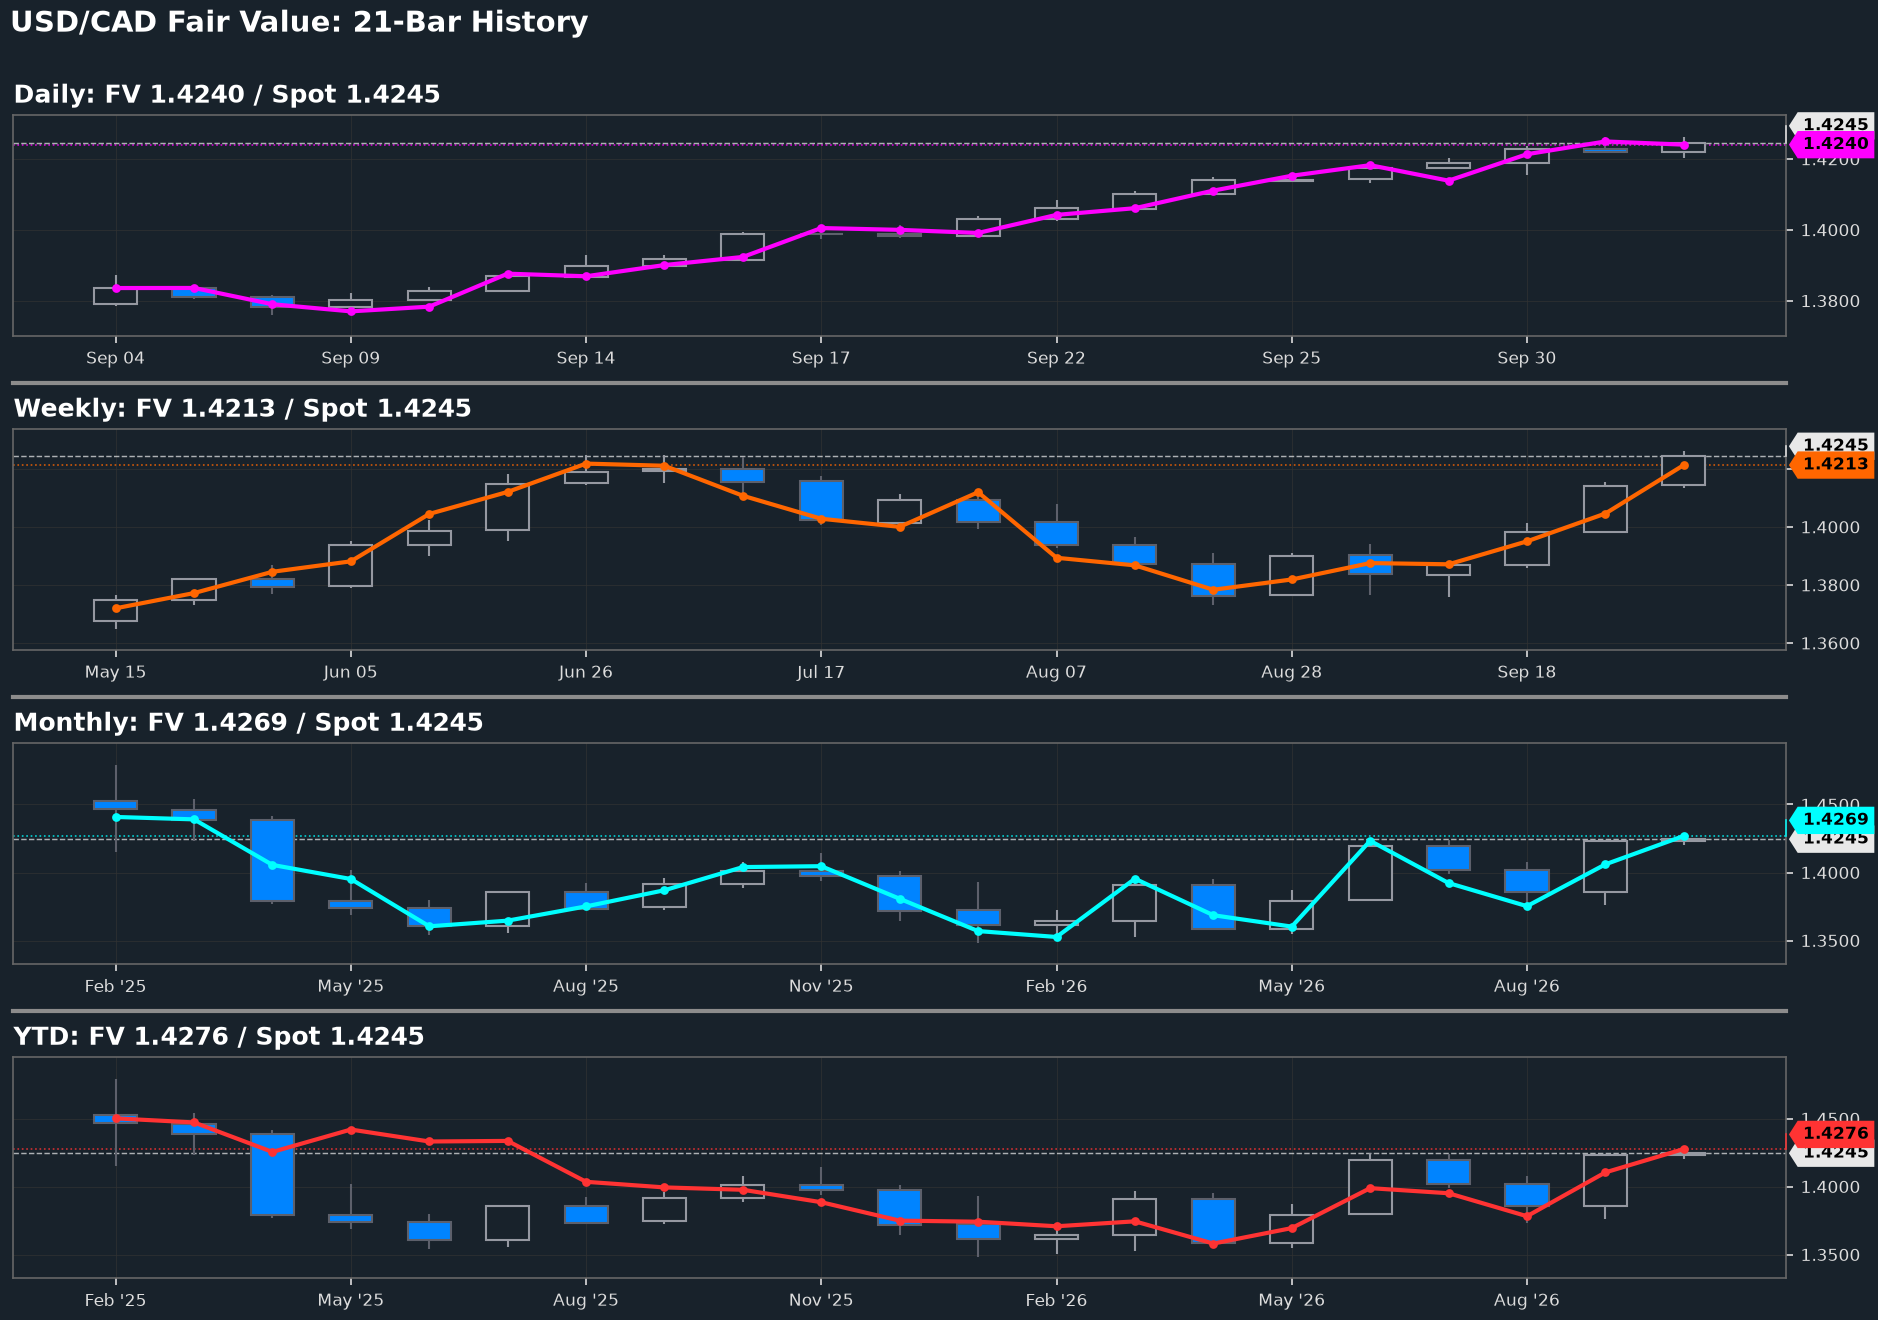
Fair value chased spot higher all week and finished straddling the close. The weekly model is 1.4213 from 1.4046, a whisker under Friday's 1.4245 close, the monthly 1.4269 and the year-to-date 1.4276 a whisker over. None of those gaps is big enough to call rich or cheap. Better, the weekly landed 72 pips over last Friday's close, so the factors paid for most of the 104-pip week. A wider 2-yr spread, softer crude and a softer stock tape all push the same way, so the rally probably reads earned rather than overdone. The monthly did the week's real travelling, up from 1.4060 and clean through spot (catch-up, we'd say) on that same factor mix. Last week's line that USD buyers shouldn't wait for a model discount has held up, and sellers get no premium up here, so timing is a levels-and-calendar job. Should crude bounce or yield spreads narrow again, fair value drops away from spot and buyers get a reason to wait.
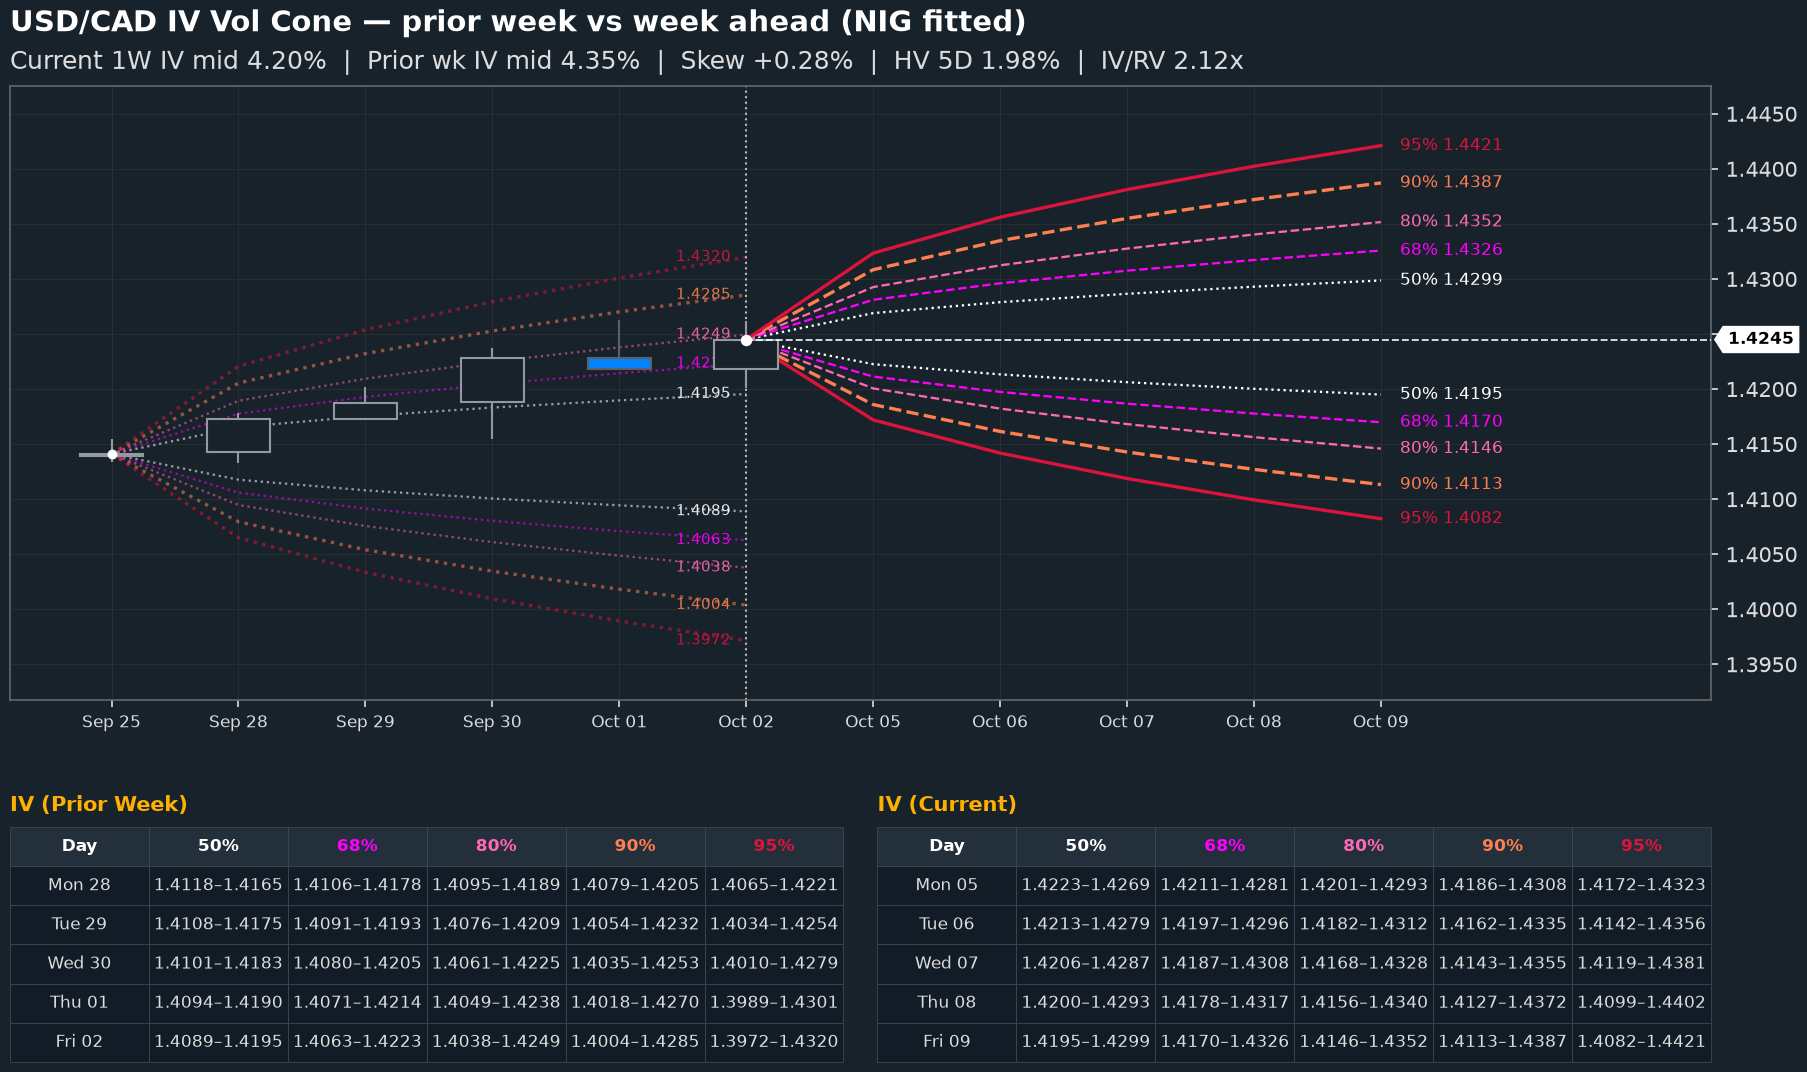
Front-end vol has eased a touch, so the week ahead is priced no wider than the one we just had, with the premium on the topside. One-week implied slipped to 4.2% from 4.35%, and the 50% range off the 1.4245 close is 1.4195 to 1.4299, 103.7 pips. Last week we leaned toward buyers covering on weakness, and they got it, the 1.4140 bid filling on Monday before the pair ran 104 pips higher, near enough the whole core range. Against 1.98% realised over the past five sessions, options charge 2.12 times the movement they got (a one-way grind travels far, realises little). Calls stay bid 0.28 vol points over puts, up from last week’s 0.18, so upside is dearer. Touch odds run 58.07% under the 1.4198 put wing against 42.54% above 1.4310, because spot sits 47 pips over the lower wing and 65 under the upper. For USD buyers, the 1.4198 wing is a fair place to rest a bid rather than pay 1.4245, though with the trend running the way it is we’d prefer bidding a bit higher, and vol gives no reason to reach past the wing, with deeper rungs the playbook’s business, since those odds don’t say where the week ends and Friday’s Cdn. jobs can run through either wing.
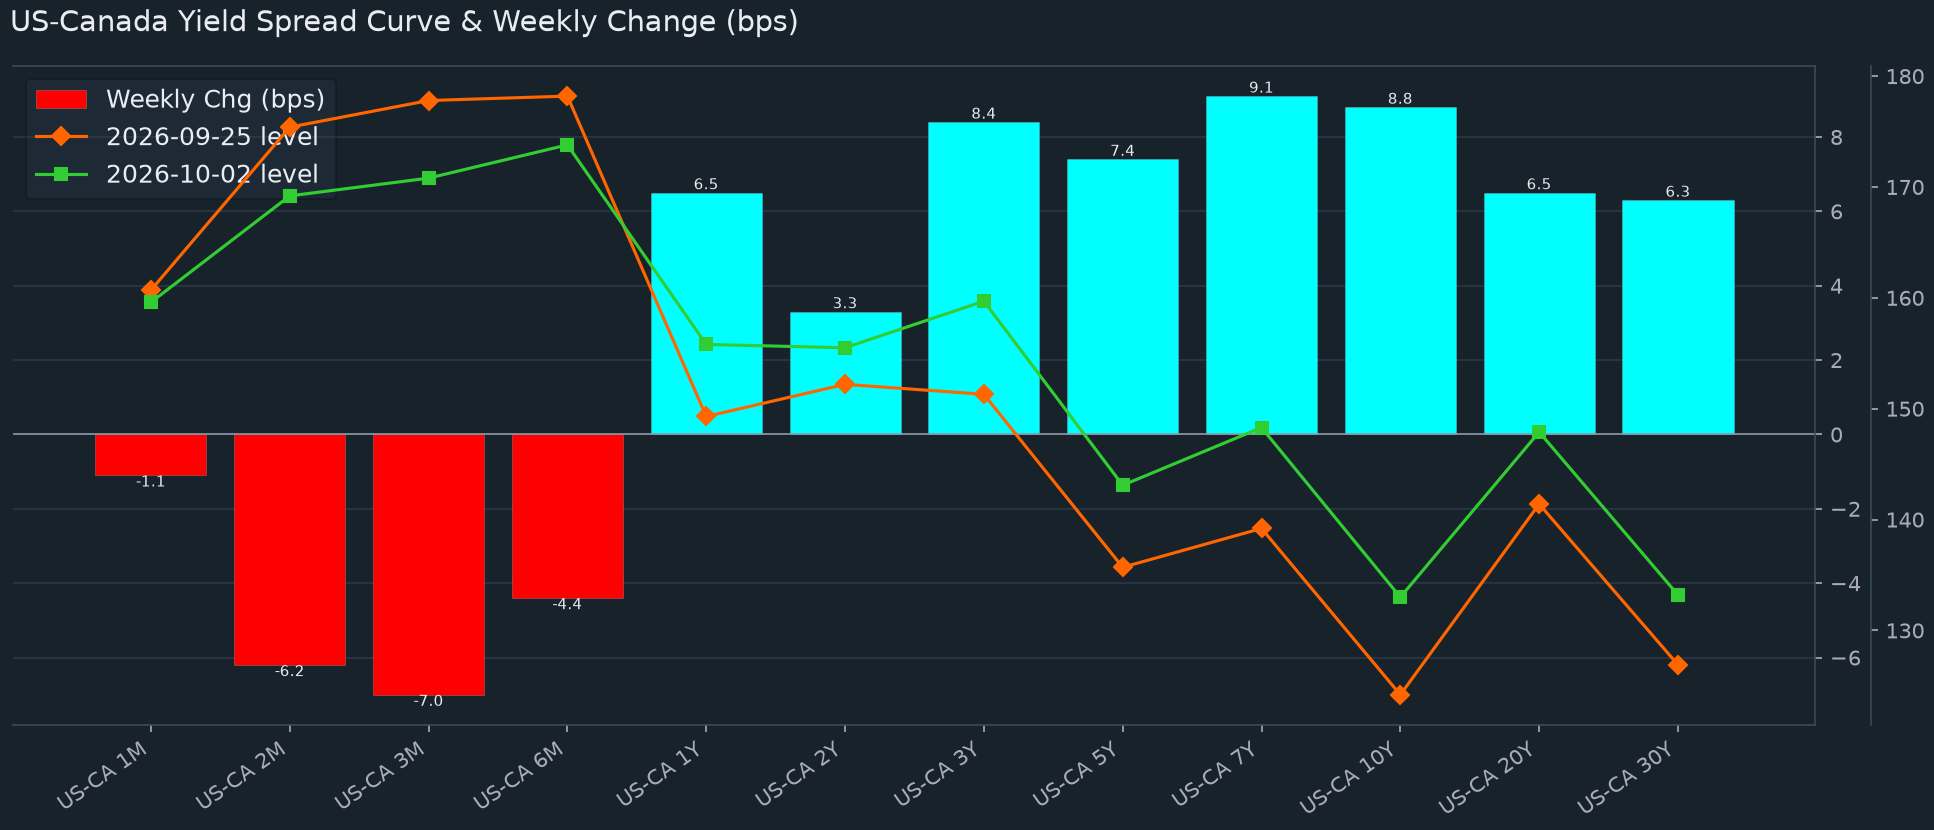
U.S.-Canada spreads twisted this past week, the bills narrower and everything from a year out wider, and USD/CAD took the wider half and ran, closing 1.4245 for a 104-pip gain. The weight sat in the belly and long end, the 10-yr premium adding 8.8 bps to 133.0 with the 20s and 30s along for the ride, while the 3-mth gave back 7.0 bps to 170.8. The 2-yr, the carry tenor we lean on, added 3.3 bps to 155.5, and how it got there matters more than the size. U.S. 2-yr yields actually slipped 3.3 bps on the week while Canada's fell twice as far, 6.6 bps, and the Canadian 1-yr dropped 7.5 bps against barely one in the U.S. That's the market trimming what it expects from the Bank of Canada, with the economy flat in July, the jobless rate at 6.4% and the new U.S. duties starting to bite, so the front end is a Canadian story. Only the 10-yr, where U.S. yields climbed 10.8 bps against 2.0 in Canada, reads like U.S. term premium. Last week we said the read would weaken if the front end followed the bills lower, and it didn't, the 1- and 2-yr widening while only the short dates gave ground. Mind you, Tuesday saw nearly every tenor narrow and spot still closed up, so the link is loose. So for USD buyers, a front end widening on Canadian softness is no reason to expect a cheaper dollar soon, and we wouldn't call narrower bills a turn until the 2-yr hands back its 3.3 bps.
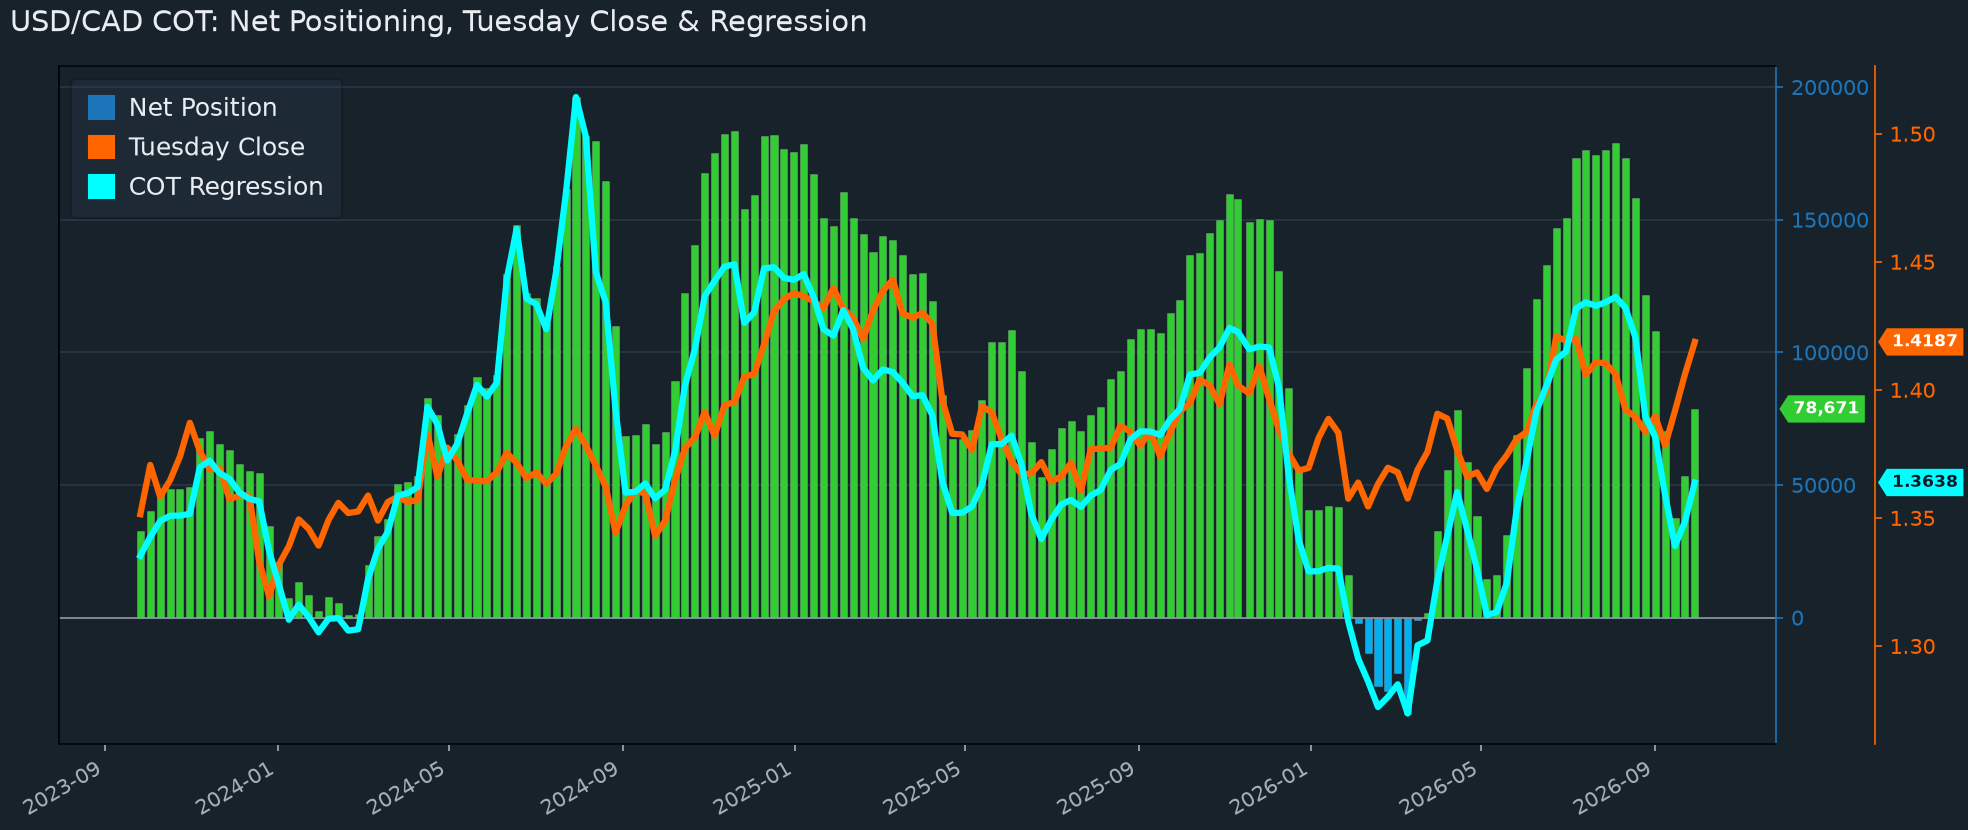
Pros added another 25.5k contracts of net-long USD/CAD, taking the book to 78.7k through Tuesday's survey. Gross longs sit at 163.7k against 85.0k shorts, and that's two straight weeks of buying after net length bottomed at 37.6k in mid-September. No mystery why, with the Tuesday close 127 pips higher on the week at 1.4187, up from 1.4060. Pros trend follow on a two to three week lag, so this is them answering a move that already happened rather than calling the next one. The positioning regression reads 1.3638 against that close, a gap of five and a half cents, a touch tighter than the five and three-quarter cents between last week's 1.3485 and 1.4060. That is what a thicker net long has historically looked like beside price (not a forecast of where it goes next). Spot has since run 58 pips past Tuesday to Friday's 1.4245, with a 1.4263 high. For USD sellers that argues patience, working offers up toward the week's high rather than paying away the bid, while buyers probably shouldn't wait on this data to hand them a cheaper level. Nothing in the data says when, or whether, an offer up there fills.
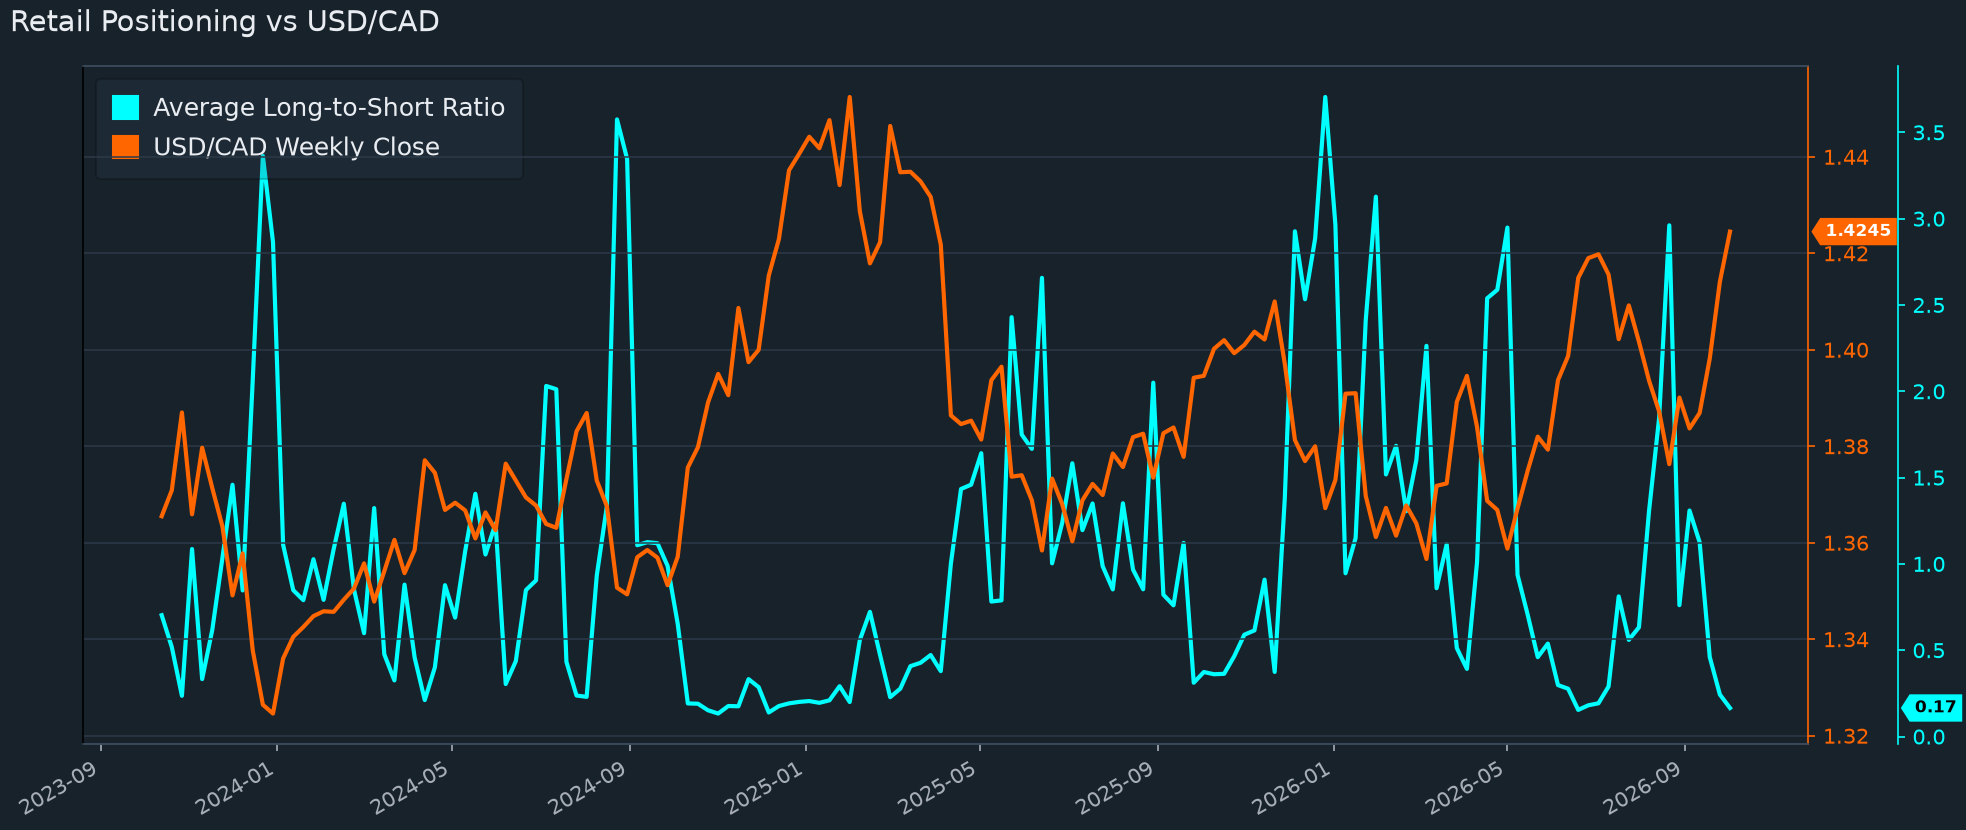
Retail sold USD/CAD into the rally again, cutting longs to 14.19% from 19.56%, a reading stretched enough now to cut both ways. The pair added 104 pips to close 1.4245 after a 1.4263 high, and retail leaned against all of it, three weeks running. Short and wrong, and the direction of that flow is still the mild tell for continuation. The level's what gives us pause, because our line in the sand is ~30% long and 14.19% sits a long way under it (85.81% of the book is already short). There's not much ammunition left there to keep feeding the rally, we'd guess. So USD sellers with near-dated receipts want an offer resting rather than a fill at Friday's close, and with the fuel this thin we'd take 1.4292 over a wait on 1.4350. USD buyers get no promise of a dip here. Positioning this one-sided can sit for weeks, so call it a lean rather than a date; the tell for a turn is the long share heading back up.
We’d lead USD buyers in at 1.4230 this week, after last week’s 1.4140 bid filled by 7 pips on Monday’s 1.4133 low. That’s where the 5-day moving average ought to sit by Monday, climbing about 20 pips a session, so it’s the trend’s own bid, 15 pips under the close, and it trades about three weeks in four. Under it, 1.4210 is today’s 5-day average, a few pips over Tuesday’s 1.4202 probing high, and the weekly pivot (1.4214) and the weekly fair value model (1.4213) sit in the same handful of pips, a proper tangle of support that has turned seven of its eight approaches on record and ought to fill a bit better than half the weeks. 1.4150 stays out for the patient, the 10-day average (1.4152) with the 23.6% give-back of the whole leg up from the Sept. 8 low at 1.3760 just under it (1.4144). That’s also the line we’d watch, because a close through 1.4150 opens 1.41 and lower, and a bid under there is catching a falling knife rather than buying value. Buyers hold the harder hand this week. The trend is the sellers’ friend, the cycle work is still 45% for the advance against 14% for a turn, and pros piled another 25.5 thousand contracts onto a 78.7 thousand net long. Monday’s ISM services is tone rather than a trade, and Friday’s Canadian jobs is the date that matters, where after August’s 41.7k loss a soft print would leave the deeper bids untouched.
We’d lift the USD sellers’ working offer to 1.4292, after all three of last week’s offers were paid and the tape ran 23 pips past the best of them (1.4240) to Thursday’s 1.4263 high. That’s the 61.8% retracement of the whole slide from February 2025’s 1.4793 peak to January’s 1.3482 low, with the weekly pivot’s first resistance at 1.4294 and the top of the week’s even-money range (1.4299) stacked just above, against a shelf that has turned price on 10 of its 12 approaches, and a rate up there gets paid roughly half the weeks. Next comes 1.4350, a round number with the weekly pivot’s second resistance (1.4343) just under it, and the first rung of the monthly sell zone on the same print. The extreme offer goes up at 1.4415, the April 1, 2025 high, the last stand before the dam broke and USD/CAD moved decisively lower. It sits inside the cycle work’s 1.4393 to 1.4457 upside zone, so treat it as the multi-week order rather than this week’s. Sure, the band holding Thursday’s high starts a couple of pips over the close, but that’s the market rather than value, and we’d not dress spot up as an offer. A soft Canadian jobs number Friday (September’s count, after August’s 41.7K drop) is probably what gets 1.4350 moving. Cycle work still backs the advance next week at 45% against 14% for a turn lower, but the longer read leans 60% bear with the pros already 78.7 thousand contracts net long, so we wouldn’t park the lot up top.
Utilizing FX Option pricing and combining probability theory and statistics, we present below, for the coming week and the upcoming month, what the numbers "suggest" for USD/CAD pricing, ranges, and probabilities using a normal distribution. The option strikes we used are noted inside the parentheses() in the row headers "Prob. Price Above Upper Boundary ( )" for the call option, and "Prob. Price Below Lower Boundary ( )" for the put option.
1-Week Probability Analysis
At Period End
At Any Time During Period
Measure:
Oct-09
Oct-02 to Oct-09
Prob. Price Above Upper Boundary (1.4310)
20.42%
42.54%
Prob. Price Below Lower Boundary (1.4198)
30.36%
58.07%
Implied Range (60% Probability)
-
1.4206 - 1.4286
Implied Range (40% Probability)
-
1.4182 - 1.4313
Implied Range (30% Probability)
-
1.4166 - 1.4329
Implied Range (20% Probability)
-
1.4146 - 1.4352
Implied Range (10% Probability)
-
1.4113 - 1.4387
Implied Range (5% Probability)
-
1.4082 - 1.4421
Prob. Price Being Between Boundaries (1.4198 - 1.4310)
49.22%
100.00%
Prob. Either Boundary Touched (1.4198 - 1.4310)
-
91.63%
Prob. Neither Boundary Touched (1.4198 - 1.4310)
-
8.37%
Prob. Price Touching Both Boundaries (1.4198 - 1.4310)
-
8.67%
1-Month Probability Analysis
At Period End
At Any Time During Period
Measure:
Nov-04
Oct-02 to Nov-04
Prob. Price Above Upper Boundary (1.4369)
22.68%
48.88%
Prob. Price Below Lower Boundary (1.4111)
27.42%
51.14%
Implied Range (60% Probability)
-
1.4157 - 1.4339
Implied Range (40% Probability)
-
1.4101 - 1.4398
Implied Range (30% Probability)
-
1.4065 - 1.4437
Implied Range (20% Probability)
-
1.4019 - 1.4487
Implied Range (10% Probability)
-
1.3945 - 1.4568
Implied Range (5% Probability)
-
1.3875 - 1.4646
Prob. Price Being Between Boundaries (1.4111 - 1.4369)
49.89%
100.00%
Prob. Either Boundary Touched (1.4111 - 1.4369)
-
91.37%
Prob. Neither Boundary Touched (1.4111 - 1.4369)
-
8.63%
Prob. Price Touching Both Boundaries (1.4111 - 1.4369)
-
8.39%
Definitions: "At Period End" means that the prices/probabilities represented under that header are expected to be relevant on that terminal day. In contrast, "At Any Time During Period" suggests that the numbers in the column below the header are likely to occur and be valid at any point during the date range given. "Prob. Price Above Upper Boundary" is the chance that the price will close above the upper boundary at the final date irrespective of where it may trade up until then. "Prob. Price Below Lower Boundary" is the chance that the price will close below the lower boundary at the final date irrespective of where it may trade up until then. "Implied Range (x% Probability)" is the range that the currency is expected to trade within given a certain probability. In other words, an Implied Range (60% probability) suggests that the exchange rate has a 60% chance of staying within that given range (e.g., 1.2500-1.2600) over the time period. "Prob. Price Being Between Boundaries" is the probability the price will end between the two boundaries "At Period End" or the probability the price will trade inside the boundaries "At Any Time During Period". "Prob. Either Boundary Touched" is the probability that either the upper or lower boundary will be touched at any point during the date range specified. Prob. Neither Boundary Touched is the probability that neither the upper nor lower boundary will be touched at any point during the date range specified. Prob. Price Touching Both Boundaries is the probability that both the upper and lower boundary will be touched at some point during the date range specified.
USD Buyers: October stays open. Monday's 1.4133 low came within 13 pips of the top of the 1.4080 to 1.4120 zone we flagged, and that was as close as it got before the pair turned higher, so nothing was done and the book still shows nothing for October through December. September closed at a weighted average of 1.4008, 220.1 bps better than spot month-end and 171.6 bps worse than the one-month forward. We'd still rather take some near-term pain than lock in at these rates. A week of US dollar strength doesn't move our October target off 1.4000, and that zone remains the place for anyone starting from scratch to get a first piece away if the pair comes back to it. Next week's odds favour the advance, 45% against 14%, so waiting isn't free, though at 42 days against a 25-day norm we'd guess this run is more tired than fresh. November and December can sit, with 1.4075 and 1.4030 where we'd like to see those dollars bought.
Year-to-date Profit/Loss (bps) vs 1-mth Forward: +743.6 bpsMonth-End: +1,416.8 bps
WAER = weighted-average entry rate; a tenor hedged below 100% marks the unhedged balance at month-end spot.
USD Sellers: All three offers were lifted last week, the best of them at 1.4240, and funds carried on to 1.4263 by Thursday. September closed out at a weighted average of 1.4256, 419 bps better than the one-month forward at 1.3837 and 28 bps over spot month-end. The program is covered through December at 1.4244, a rate spot has now caught by a single pip (so much for the cushion), and we're holding it as is. We don't think this push has a long, sustained run to much higher rates in it, those hedges only cover the next three months, and the program is well in the black, 2,666.6 bps ahead of the one-month forward for the year. For October receipts sitting outside that book, we'd work 1.4292 for half and 1.4350 for a quarter, and leave the last quarter at 1.4415 as a multi-week order. October's month-end is still a few weeks out, so there's time to let them work, and another soft Canadian jobs print on Friday, after August's 41.7K drop, is probably what gets 1.4350 filled. With the longer read still 60% bear, we wouldn't hold the whole amount back for the highest offer.
Friday’s Canadian jobs report is the only release here big enough to set a direction. Our own testing puts a one standard deviation surprise on the employment change at roughly 25 pips, comfortably the heaviest hitter of the week, and September is the first count since the new American duties on Canadian goods started biting in late August. We’d lean toward a bounce in the headline after August’s slide with soft detail underneath, and a weak print should carry further than a strong one.
Everything before Friday is filler, and that’s worth knowing in advance. Monday’s ISM services is the only US number with real weight, Wednesday’s minutes cover a meeting the market has already picked over for three weeks, and quiet calendars have a habit of letting whatever momentum exists carry on unchallenged.
USD/CAD closed 1.4245, a fourth straight weekly close higher. That’s 104 pips on a 130-pip week, and the cycle work backs more of the same at 45% against 14% for a turn lower. The 41% odds on another week of chopping are the part we’d take seriously.
Both sides of the book get something to work with. Buyers bid 1.4230 first, 1.4210 underneath and 1.4150 held back for a week that genuinely turns, while sellers offer 1.4292, then 1.4350, with 1.4415 the multi-week order. Anyone with a payment that can’t wait shouldn’t leave everything resting below the market into Friday.
The week’s only serious US data lands Monday, and then the well runs dry. ISM services is seen at 55.7 after 55.4, with the final S&P Global services PMI unchanged at 58.7 and the composite at 58.4. The headline isn’t the interesting part. Prices paid were 72.6 last time, which is hot for a services survey, while the employment index sat at 47.8, meaning outright contraction. Costs up, hiring down (not a pairing any central bank enjoys reading over coffee). We have nothing tested that makes ISM services a dependable mover for this pair, so we would treat it as tone rather than a trade. A firm headline with prices still camped in the low 70s keeps the 1.4292 offer honest. A soft one, with employment sinking further, and we’d probably look for the pair to ease back toward 1.4230 and 1.4210, where the 5-day average is sitting. Canada has nothing out at all, so the loonie takes whatever it’s given, and the rest of the week’s US slate is thinner still.
Canada finally gets a say on Tuesday, for what it’s worth. The August trade balance follows a 0.77B surplus and Ivey PMI follows 64.3, about as expansionary as that survey ever reads. Both are tested movers in our own work and both are small beer, roughly 5 pips per one standard deviation surprise on the trade number and 4 on Ivey. Enough to shift a week? Not a hope. The US trade balance is out at the same moment after -88.60B, with exports at 310.70B against imports of 399.30B, and these days that report gets read as a tariff scorecard more than an economic release. Bowman and Williams are both scheduled to speak, and we are not going to put words in their mouths, though after a September decision that drew no dissent there cannot be a great deal left unsaid. We’d guess a Tuesday that stays inside the one-week band, call it 1.4195 to 1.4299, which makes it a perfectly good day to leave orders working rather than chase.
Hump day hands the market the FOMC minutes [don’t hold your breath]. They cover September, the decision was unanimous, and every Fed head with a microphone has had three weeks to explain themselves since, so we’d be surprised if there’s a nugget left in there worth trading. The NY Fed’s one-year consumer inflation expectations follow 3.6%, and we have never rated consumer inflation surveys as forecasts, though the Fed does glance at them, so a big jump would at least get quoted at us. Crude inventories after 0.922M and Cushing after 0.553M only reach USD/CAD by way of oil, and oil lost 1.25% last week without doing the Canadian dollar any favours in either direction, which tells you where the steering is coming from at the moment. Wednesday is a push. We would expect whatever tone Monday and Tuesday set to carry through, and if the pair is still parked in the mid-1.42s by the afternoon, that’s the market saying it wants Friday’s jobs number before it commits to anything.
Thursday is a wash. Jobless claims follow 197K with continuing claims at 1,701K, and our testing gives claims under 2 pips per standard deviation surprise, which is a polite way of saying ignore it unless the number is enormous. Continuing claims are the better tell for whether hiring has actually stalled, though not on one week’s reading. The growth tracker gets another update and that is the lot. Use the day for positioning instead. USD buyers who cannot afford to carry Friday’s jobs report should take a piece here rather than hope, and sellers can leave 1.4292 resting and go find something more useful to do.
It all gets stacked onto Friday morning. Canada’s September employment follows a nasty -41.7K with the jobless rate at 6.4%, and it’s the first count since the new American duties on Canadian goods actually started biting in late August. It is also the biggest tested mover on this board by a wide margin, about 25 pips per one standard deviation surprise on the employment change and about 15 on the unemployment rate, and the two normally pull the same way. Our read is a bounce in the headline, because a survey this noisy rarely prints two slides that size back to back, with the detail staying soft underneath (full-time work, private hiring and hours most of all) and the jobless rate holding 6.4% or nudging higher. September’s count is also prone to back-to-school seasonal quirks in education jobs, so a mixed print is the likeliest outcome and the hardest to trade. The reaction should be lopsided too. A weak number confirms what the market already believes about tariffs and the Bank of Canada and probably carries through 1.4292 toward 1.4350. A strong one is easier to dismiss as noise, so a dip toward 1.4230 or 1.4210 is more likely to get bought than to run. Michigan’s preliminary numbers follow (sentiment after 48.1, one-year inflation expectations 4.6%, five-year 3.4%) and they’re tested too, around 4 pips a standard deviation and typically about three times the noise of a normal twenty-minute window. Small, but enough to improve an order already working. Rig counts close the week out and nobody trades those.
Summing up next week, we would rather not be timid twice running. USD/CAD closed 1.4245, up 104 pips on a 130-pip week between 1.4133 and 1.4263, and that’s a fourth weekly close higher on the trot. Last week’s upside lean was right but too timid. The 1.4140 bid filled on Monday’s 1.4133 low, which we’ll take, but all three offers were paid by Thursday and the tape ran 23 pips past the best of them (1.4240), so the sell side was pitched far too close again. The cycle work gives the advance 45% next week against 14% for a turn lower, the 2-year US premium widened another 3.3 bps to 155.5, and the fair value models straddle spot (weekly 1.4213 below, monthly 1.4269 above), so valuation isn’t arguing for anybody. The macro backdrop leans the same way, with Canada’s economy flat, the new U.S. duties biting and the front end pricing a softer Bank of Canada. What gives us pause is the crowd. Pro accounts added 25.5 thousand contracts to a net long of 78.7 thousand while retail sits 85.81% short, which is a trend wearing a crowded trade’s clothes, and crowded trades do unwind. So, buyers bid 1.4230, then 1.4210, with 1.4150 kept back for a week that genuinely turns, and sellers work 1.4292, then 1.4350, with 1.4415 the multi-week order and the monthly offers up to 1.4395 along the way. If you must be done before Friday, do part of it early and leave the balance working.
Bastion Currency Management Ltd. - 10 Floor Bankers Hall West, Suite 1000, 888 - 3rd Street SW, Calgary AB T2P 5C5
Website: www.bastioncm.com
This email was sent from an unattended mailbox and cannot receive replies. If you have questions or concerns, call us at +1 (403) 879 6537 - or direct your enquiry to info@bastioncm.com.
Privacy Statement:
You are receiving this email because you have subscribed to receive
it.
To find out more about how we may collect, use and share your personal
information please read our Privacy Policy
If you no longer wish to receive these emails, simply click on the
following link Unsubscribe
Disclaimer: By proceeding to use our website and/or newsletter and/or services, you acknowledge your understanding and acceptance of the terms of use, disclosure statement, high risk warning and advisory warning (hereafter referred to collectively as the “terms of use”) located HERE and agree to abide to the terms of use set forth in the terms of use. If you do not agree to the terms that are set forth, please cease to use our website and/or newsletter and/or services immediately. Bastion Currency Management Ltd. (hereafter referred to collectively as “BCM”) does not provide its services to those that disagree with its terms of use. The information and the views of BCM and/or its employees and/or agents and/or affiliates is intended for educational purposes only. BCM and/or its employees or agents are not registered advisors and do not give investment advice. All comments are an expression of opinion only and to the extent that any communication such as emails, phone conversation, the website, the newsletter (not an exhaustive list) include(s) suggestions as to various possible investment strategies, which users might consider, it does so in only general terms without reference to the personal factors which should determine any user's investment decisions. Nothing contained in this service constitutes personalized investment advice nor should anything be construed in any manner whatsoever as recommendations to buy or sell a stock, ETF, option, derivatives product, futures contract, bond, commodity, foreign exchange or any other financial instrument/product at any time (hereafter collectively referred to as "security" and/or "securities") . BCM does not warrant the accuracy, completeness or timeliness of the information in this website, and any errors shall not be made the basis for any claim against BCM. While BCM believe their statements to be true, they always depend on the reliability of their own credible sources. Of course BCM recommends that you consult with a qualified investment advisor, one licensed by appropriate regulatory agencies in your legal jurisdiction, before making any investment decisions, and barring that, BCM encourages you confirm the facts on your own before making important investment commitments. This is a financial news and information service and any news, opinions, research, data, or other information contained within this website and/or newsletter or other communications is provided as general market commentary or information and does not constitute investment or trading advice or form part of any invitation or inducement to buy or sell any security. BCM would like to remind you that the data contained in this website and/or newsletter is not necessarily real-time nor accurate. All CFDs (stocks, indexes, futures) and foreign exchange prices are not provided by exchanges but rather by market makers, and so prices may not be accurate and may differ from the actual market price, meaning prices are indicative and not appropriate for trading purposes. Therefore BCM doesn't bear any responsibility for any trading losses you might incur as a result of using this data. BCM or anyone involved with BCM will not accept any liability for loss or damage as a result of reliance on the information including data, quotes, charts and buy/sell signals contained within this website and/or newsletter. Please be fully informed regarding the risks and costs associated with trading the financial markets, it is one of the riskiest investment forms possible.