
Read the changes
Compare consecutive policy statements, with coherent additions and deletions and the full old and new text available.
Read what changed in Fed and Bank of Canada statements, and compare Fed projections with market pricing.
Select a historical statement comparison from the archive, read changes in context, and open the original statements and related meeting materials. The archive begins in November 2018.
The Fed dot plot view compares participants' projections and medians across meetings alongside December fed-funds futures pricing and an approximately five-year futures reference for the longer run.
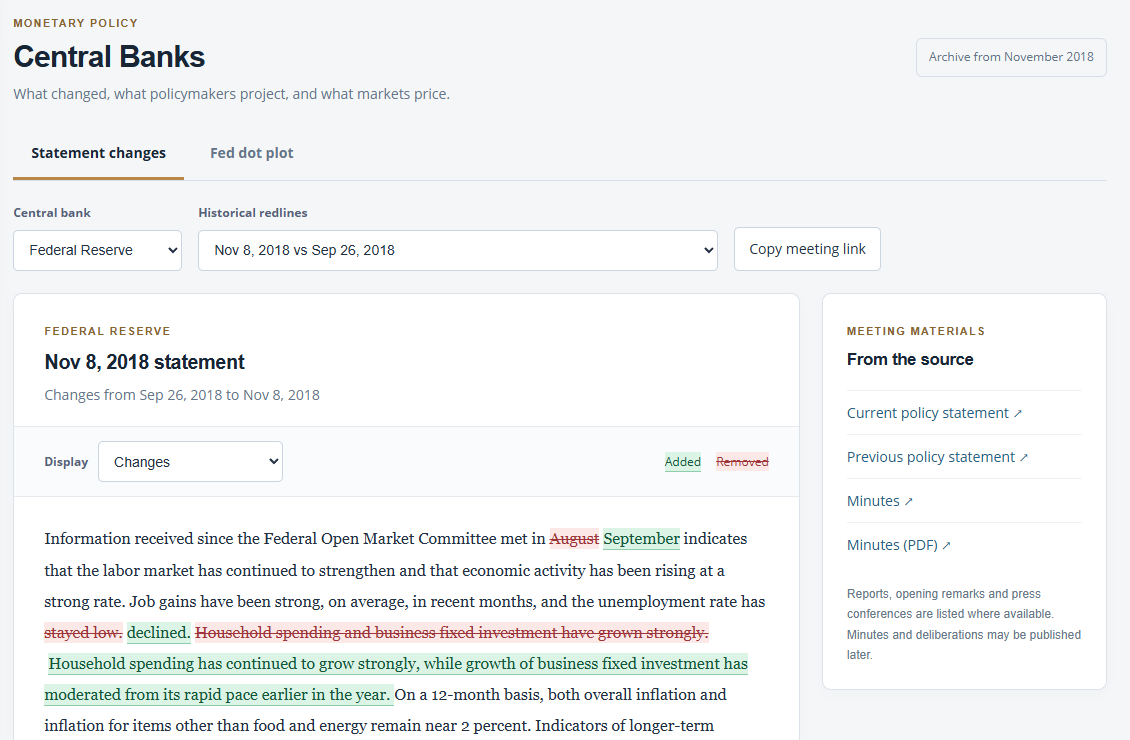
Original language, readable changes and source documents in one meeting view.
Compare consecutive policy statements, with coherent additions and deletions and the full old and new text available.
Follow links to official statements, press conferences, opening remarks and economic projections or policy reports where available.
See how Fed projections and futures-implied reference rates differ, with the market observation date and contract identified.
Fed projections describe participants' assessments of appropriate policy. December futures reference the average effective fed-funds rate during that month. The longer-run market comparison uses a fed-funds contract approximately five years forward; it does not assign a maturity to the Fed's longer-run projection. Market prices are indicative, and missing historical observations remain unavailable.