

1. Choose the exposure
Select USD/CAD, EUR/CAD, GBP/CAD, CAD/JPY, EUR/USD, GBP/USD, AUD/USD, or USD/JPY, then choose the one-week or one-month horizon.
Turn option-implied volatility into a practical picture of the ranges an FX pair may travel over the next week or month.
An FX volatility cone starts at the current spot rate and projects a series of upper and lower range bands through an option horizon. Bastion's chart displays modelled central 50%, 68%, 80%, 90%, and 95% ranges, alongside daily spot candles, for one-week and one-month horizons.
The upper and lower paths are informed separately by indicative 25-delta call and put implied volatilities, so the cone can reflect option-market skew rather than assuming that upside and downside risk are identical. Each pair and tenor uses a reviewed fitted distribution instead of one blanket assumption across every currency.
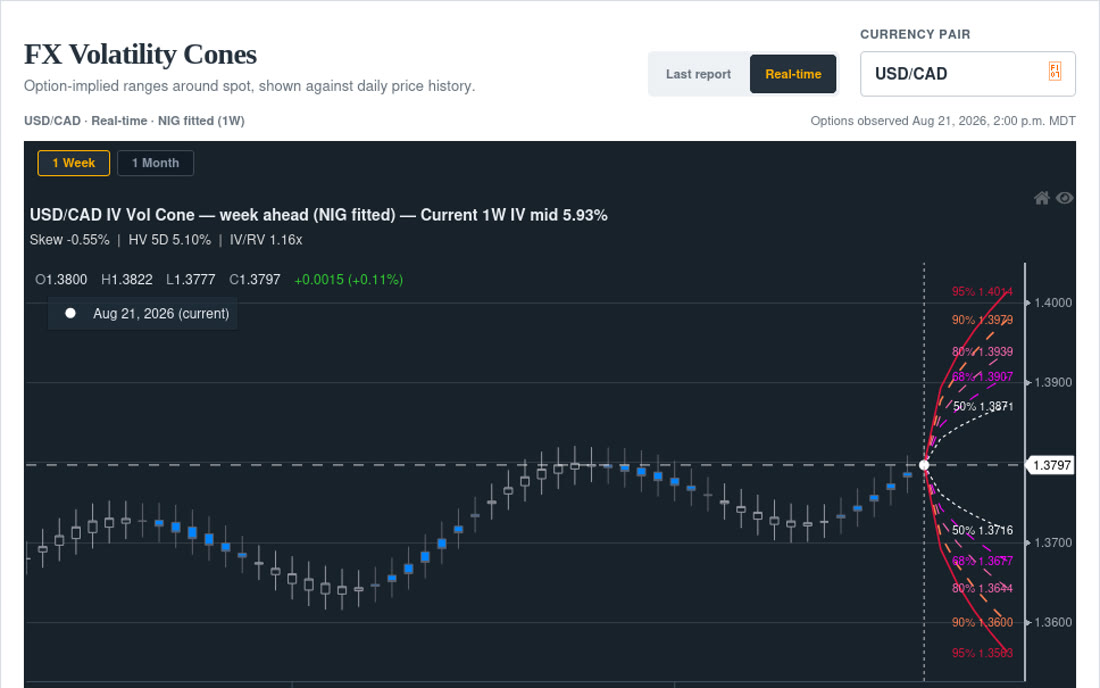
The bands are a way to frame uncertainty, not price targets. Wider bands indicate a broader modelled range; asymmetry shows where call and put volatility differ.
Select USD/CAD, EUR/CAD, GBP/CAD, CAD/JPY, EUR/USD, GBP/USD, AUD/USD, or USD/JPY, then choose the one-week or one-month horizon.
Each percentage label marks a modelled central range around spot. The bands widen through the horizon, while different upper and lower paths carry the option-market skew.
Compare the current cone with the last report or selected historical cones to see what the option market implied at earlier dates and how spot subsequently moved.
Start with the date and currency of the payable, then identify which side of the selected pair represents a more expensive purchase. A Canadian importer buying USD, for example, is hurt by a higher USD/CAD rate. The cone shows how that adverse side compares with the budget rate, pricing assumption, or hedge-review threshold over the relevant horizon.
If a threshold sits inside a narrower band, it belongs in the near-term decision conversation. If it lies outside even the wider bands, it may still be possible, but it should not be presented as the option market's central case.
An exporter starts from the opposite cash flow: foreign currency will be sold and converted into the home currency. A Canadian exporter receiving USD, for example, is hurt by a lower USD/CAD rate. The lower cone bands help test the home-currency proceeds against budget, margin, covenant, or hedge-policy thresholds.
The same chart can therefore support both an importer and an exporter, but the adverse side changes with the exposure and pair orientation. The tool does not decide which band a company should hedge.
Stress-testing short-horizon payables and receivables, comparing risk with a budget or trigger rate, discussing hedge urgency, and explaining how option-implied uncertainty has changed.
Treating a band as a guaranteed boundary, a directional forecast, or a hedge recommendation. A 95% modelled range can still be breached, and the distribution is only as useful as its inputs and assumptions.
The cones are modelled ranges built from indicative option and spot inputs that may be delayed, incomplete, or unavailable. Their percentage labels describe the selected model's central ranges; they are not guarantees of realized coverage, forecasts of direction, or executable option quotes. Historical cones are retrospective context, not evidence that the same model, inputs, or market conditions will hold in the future. This tool provides informational market context only and is not a stand-alone instruction to trade or hedge.
Tell us whether you manage imports, exports, or both, which currency pairs matter, and what payment or receipt horizons you review.